Automatic MLFlow logging for Scikit Learn
Marton Trencseni - Fri 15 January 2021 - Data
Introduction
The previous post was about getting MLFlow up and running and emitting some simple logs using log_artifact(), log_param(), log_metric(). In this post, I will look at the automatic logging capabilities of MLFlow, specifically for Scikit Learn. The relevant documentation is here. As the documentation states, this is an experimental feature, and in fact while writing this blog post I ran into a bug. If you're curious, read on. The source code is up on Github.
Autologging for regression
First, we have to turn on MLFlow itself and the autologging:
import mlflow
mlflow.set_tracking_uri('http://127.0.0.1:5000')  # set up connection
mlflow.set_experiment('test-experiment')          # set the experiment
mlflow.sklearn.autolog()
Let's start with a regression model and see what kind of logging we get from MLFlow:
import numpy as np
from sklearn.linear_model import LinearRegression

def make_data(num_points):
    x = np.random.rand(num_points, 1)
    e = np.random.rand(num_points, 1) / 10.0
    y = x + e
    return x, y

num_points = 1000
with mlflow.start_run():
    x, y = make_data(num_points)
    model = LinearRegression()
    model.fit(x, y)
MLFlow logs the following parameters:
copy_Xfit_interceptn_jobsnormalize
These are the parameters of the LinearRegression() constuctor. Since I didn't specify anything, the logged values are the default values.
MLFlow logs the following training metrics, computed at the end of model.fit():
training_maetraining_msetraining_r2_scoretraining_rmsetraining_score
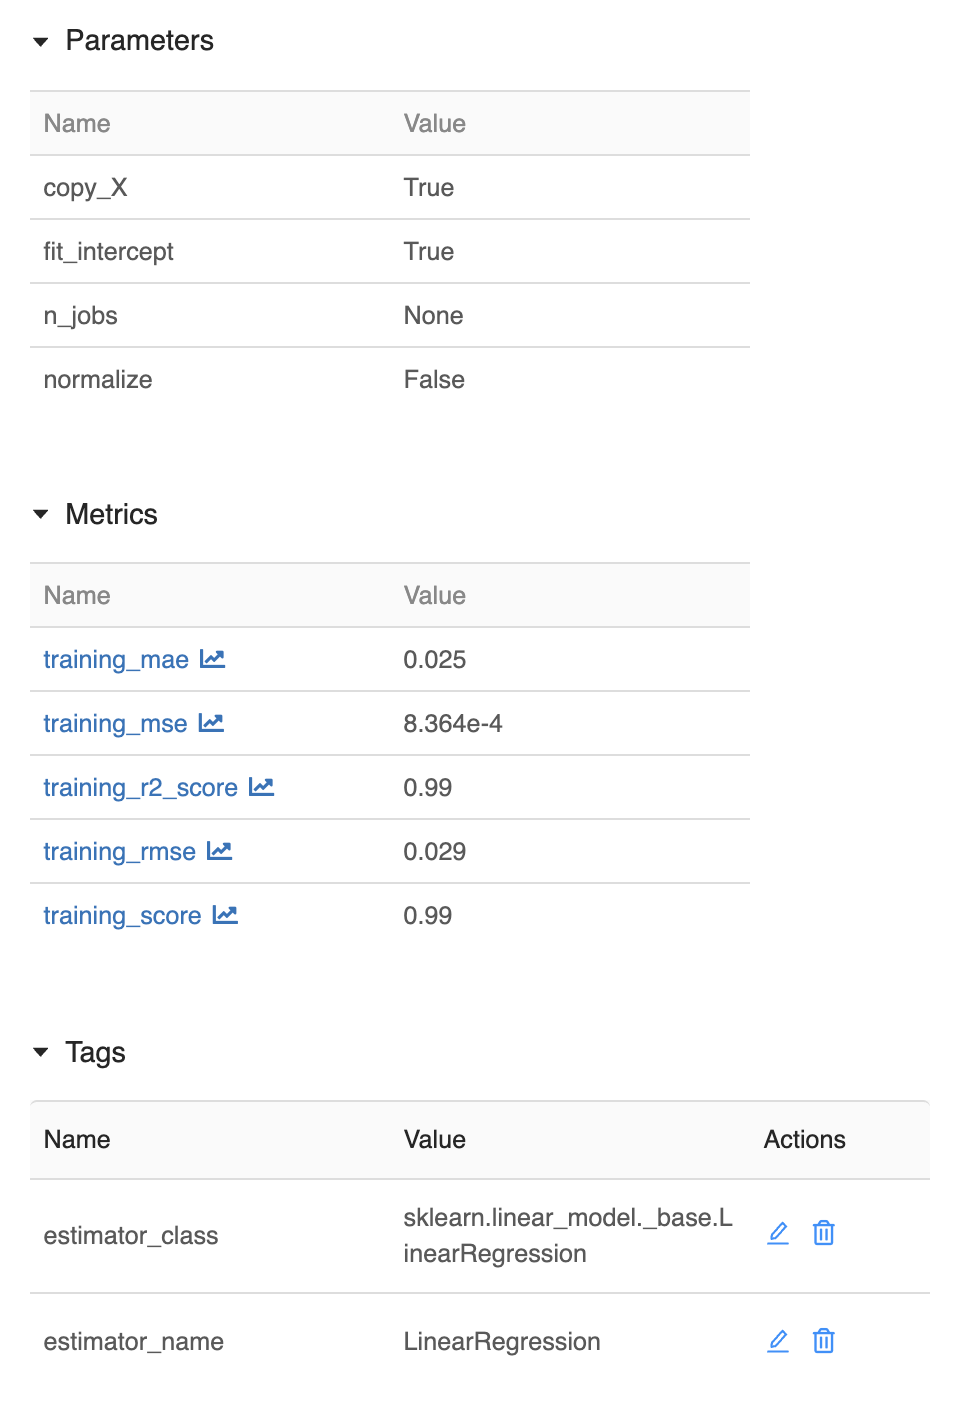
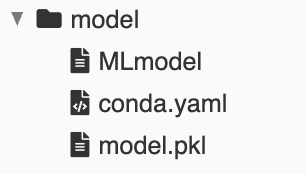
Additionally, MLFlow logs the following artifacts:
MLModel: MLFlow's environment descriptor, contains things like the Python and the SKL versionconda.yaml: another env descriptor, this one for Condamodel.pkl: the pickled model object
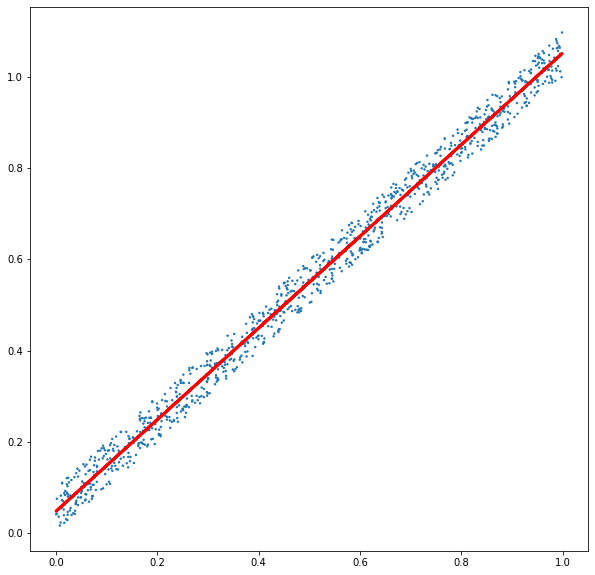
However, there are some additional artifacts that make sense even for such a toy project:
- a scatterplot showing the data and the fit line
- the source code of the ipython notebook: for this we need some ipython magic, check the notebook how to accomplish this
The improved version:
def plot(x, y, model):
    plt.figure(figsize=(10, 10))
    plt.scatter(x, y, [2]*len(x))
    y_pred = model.predict(x)
    plt.plot(x, y_pred, color='red', linewidth=3)

def mlflow_log():
    filename = 'scatter.png'
    plt.savefig(filename)
    mlflow.log_artifact(filename, 'scatter plot with fit line')
    mlflow.log_artifact(nb_full_path, 'notebook source')

num_points = 1000
with mlflow.start_run():
    x, y = make_data(num_points)
    model = LinearRegression()
    model.fit(x, y)
    plot(x, y, model)
    mlflow_log()
This now also logs the scatter plot and the source:
Autologging for classification
Let's set up a similar toy problem for classification:
import numpy as np
from matplotlib import pyplot as plt
from sklearn.linear_model import LogisticRegression

def make_data(num_points):
    x = np.random.rand(num_points, 1)
    y = np.random.rand(num_points, 1)
    y = np.ravel(np.round(y))
    return x, y

def plot(x, y, model):
    plt.figure(figsize=(10, 10))
    plt.scatter(x, y, [2]*len(x))
    y_pred = model.predict(x)
    plt.scatter(x, y_pred, [2]*len(x), color='red')

num_points = 1000
with mlflow.start_run():
    x, y = make_data(num_points)
    model = LogisticRegression()
    model.fit(x, y)
    plot(x, y, model)
Similar to the regression case, MLFow logs the parameters of the model's constuctor, and the following metrics of the fit() training:
training_accuracy_scoretraining_f1_scoretraining_log_losstraining_precision_scoretraining_recall_scoretraining_score
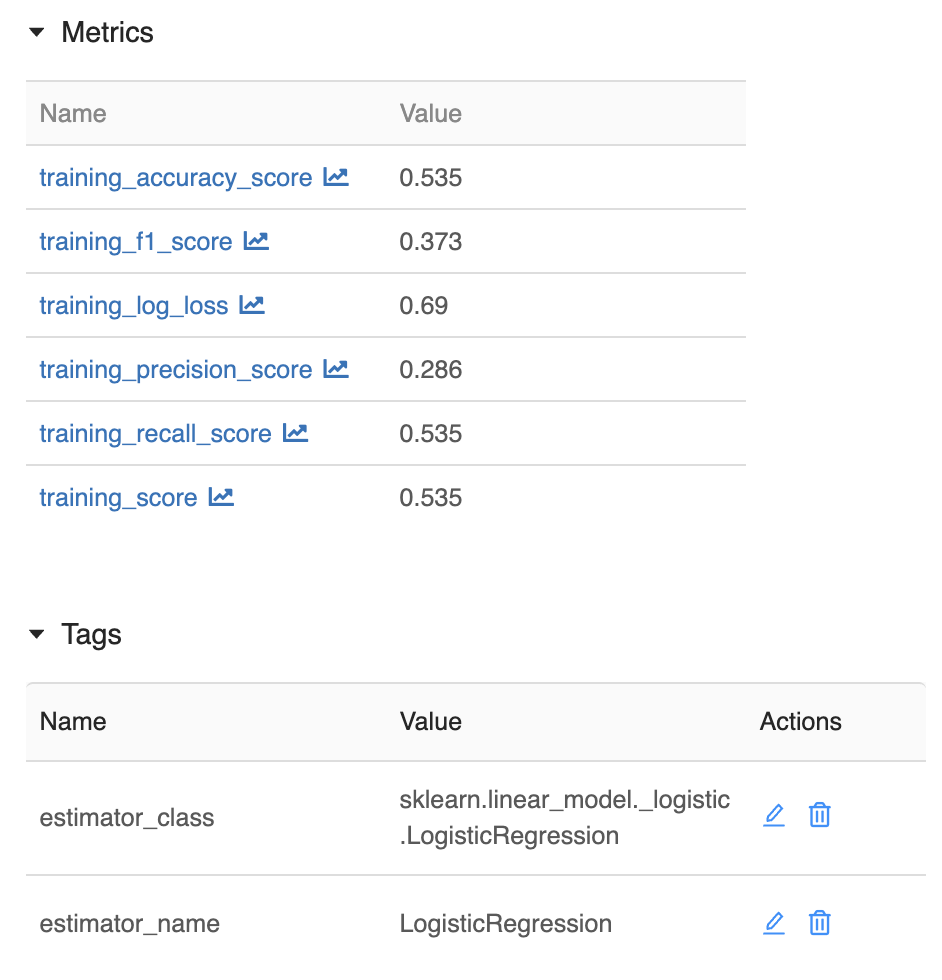
This time, we also get some nice artifact charts for free from MLFlow:
training_confusion_matrix.pngtraining_precision_recall_curve.pngtraining_roc_curve.png
However, this is buggy! There's a bug in the MLFlow code, where it passes y_pred instead of y_true to the SKL drawing functions. Because of this, the above 3 artifacts make it seem like the model has perfectly learned the training set. For example, training_confusion_matrix.png always looks like this:
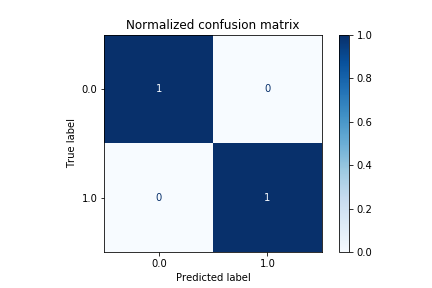
So I filed a bug report, and then a pull request to fix the bug.
Conclusion
Clearly the automatic logging capabilities are still experimental, but it's a great start. I will definitely turn on automatic logging for my production Scikit Learn models.
Happy MLFlowing!