Real-world experiments: 5 Lessons from Google, Bing, Netflix and Alibaba
Marton Trencseni - Sun 18 June 2023 - Data
Introduction
I have written more than 20 articles on A/B testing on Bytepawn, but most of them are about the technical, statistical aspects. In this post, I will discuss five lessons from large-scale experiments conducted by Google, Bing, Netflix and Alibaba. Each story briefly describes a specific experiment conducted by these companies and the consequent lessons learned. From Ronny Kohavi's enlightening "1 out of 3 rule" at Microsoft that reshapes the understanding of failure in the realm of innovation, to Google's seemingly trivial yet significantly impactful experiment on the '41 shades of blue', these narratives underline how experimentation often leads to surprising revelations and success. Similarly, Alibaba's large-scale randomized field experiment and Netflix's personalized movie image testing provide evidence for the importance of personalization. These stories prove the power of A/B testing and can be an inspiration for practicioners.
Kohavi's 1 out of 3 rule
Ronny Kohavi, formerly Vice President, Analysis & Experimentation on Bing, author of the excellent book Trustworthy Online Controlled Experiments famously writes in Online Experimentation at Microsoft: When we first shared some of the above statistics at Microsoft, many people dismissed them. Now that we have run many experiments, we can report that Microsoft is no different. Evaluating well-designed and executed experiments that were designed to improve a key metric, only about one-third were successful at improving the key metric!
In the later presentation titled Lessons from Running A/B/n Tests for 12 years states that 1/3 of ideas were positive ideas and statistically significant, 1/3 of ideas were flat: no statistically significant difference, 1/3 of ideas were negative and statistically significant. At Bing, the success rate is lower; the low success rate has been documented many times across multiple companies.
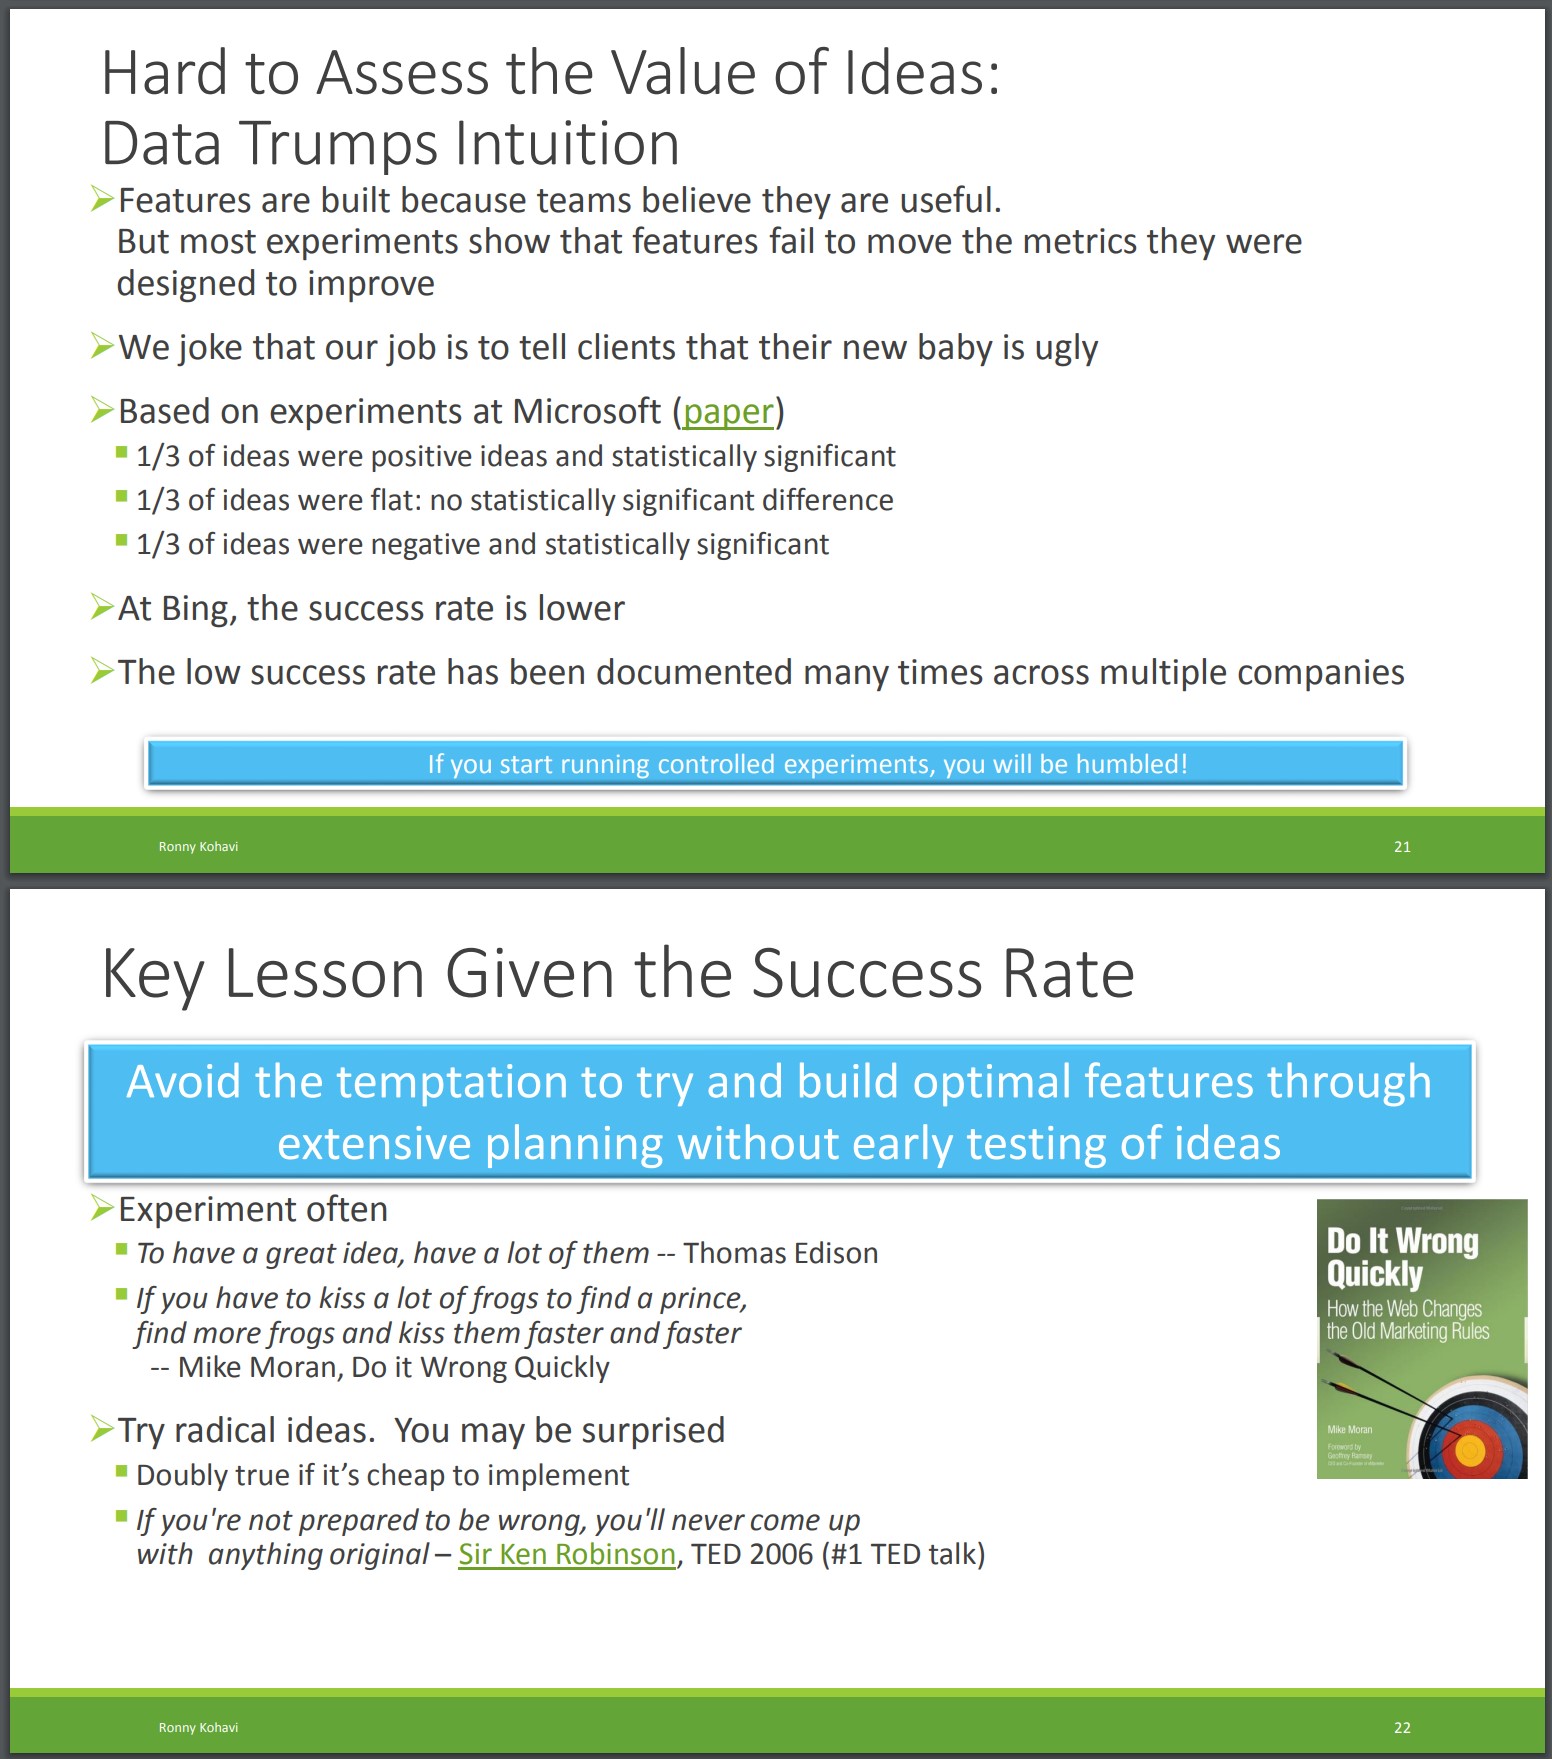
Lesson: most of your ideas will not work. This is learning, not failure.
Google's 41 shades of blue
The 2014 Guardian article titled Why Google has 200m reasons to put engineers over designers describes the following experiment at Google.
Roughly half a decade ago, Google initiated its venture into Gmail advertising. As was the case with their search engine, ads were presented as small blue links leading to various websites. However, it was observed that the shade of blue used in these two distinct products varied when linked to advertisements. Traditionally, the choice of color in such a scenario would have been determined by a chief designer or a marketing director, in what might be referred to as 'the hippo approach'. But in the data-driven world, Google decided to approach this differently.

They conducted a series of '1%' experiments, exposing one percent of users to a specific shade of blue, with each test incorporating a different hue. To ensure thoroughness, forty different variations of blue were tested in this manner. The objective was to discern the most popular shade among users, measured by the frequency of clicks. The results led to the discovery that a marginally purpler blue was more click-friendly than a slightly greener shade. This seemingly minor adjustment, given the magnitude of Google's business operations, had a significant financial impact: an additional $200 million per year in ad revenue.
Lesson: if you have the sample size, don't test 2 or 3 variants, test a lot of them to find the optimum.
Bing's unexpected big win
In Chapter 1 of Trustworthy Online Controlled Experiments, Kohavi opens with the following experiment, also descibed in the HBR article titled The Surprising Power of Online Experiments:
In the year 2012, an innovative idea emerged from within the Bing team at Microsoft. An employee proposed a change in the way ad headlines were displayed on the search engine. It was a straightforward implementation that wouldn't take more than a few days of engineering effort. However, being one amongst a sea of proposed ideas, it was deemed low priority by program managers. As a result, the idea remained untouched for over six months. It wasn't until an engineer, noting the minor cost of writing the necessary code, decided to launch an A/B test to evaluate the potential impact of this seemingly inconsequential change.
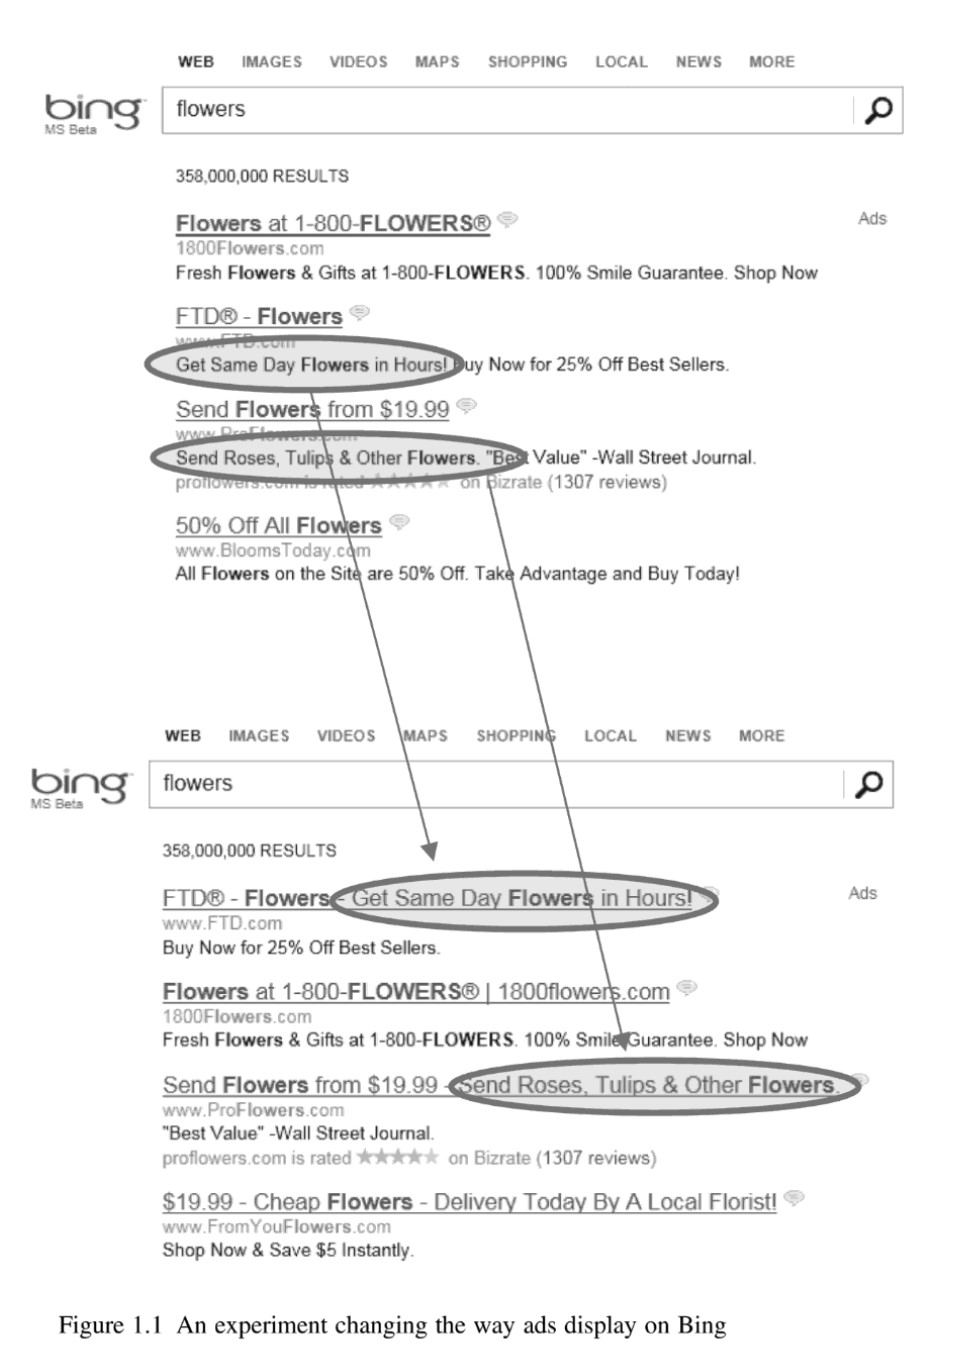
Within a matter of hours, the newly introduced headline variation started generating revenue at an unusually high rate, tripping the "too good to be true" alarm. While such alerts often indicate a glitch, in this case, it pointed towards a genuine increase in revenue. Analysis revealed a staggering 12% increase in revenue, translating to an annual boost of over $100 million in the United States alone, without any negative impact on key user-experience metrics. Despite being one of the most lucrative ideas in Bing's history, its value remained unrecognized until this experiment. This serves as a humbling reminder of the challenge in assessing the potential of new ideas and underscores the benefits of possessing the ability to run numerous inexpensive tests concurrently, a practice more businesses are beginning to appreciate.
Lesson: you don't know which experiment will yield big results.
Alibaba's personalization experiment
In the paper The Value of Personal Data in Internet Commerce researchers from Alibaba share surprising results.
In collaboration with Alibaba's E-commerce platform, a large-scale randomized field experiment was conducted involving 555,800 customers. Upon opening the Alibaba app, these users were exposed to the homepage recommendation. Half of the user base was randomly selected and assigned to a treatment group. For these users, personal data like demographics, past clicks, and purchase behaviors were not employed in the product recommendations on the homepage. The other half, constituting the control group, experienced the standard product recommendation process, which utilized their personal data. The stakes of this experiment were significant, given the reliance of the platform on homepage recommendations to match its vast user base with countless merchants and considering that customers spend a substantial amount of time interacting with recommended products.
The experiment illuminated the impact of personal data regulation on user engagement and transaction outcomes. The findings revealed a notable increase in product recommendation concentration and a significant decrease in the alignment of product recommendations with customer preferences in the treatment group compared to the control group. Moreover, recommendations made without personal data led to a drastic drop in matching outcomes, as measured by both customer engagement and market transactions. There was an immediate 75% decrease in customers' click-through rate (CTR) on the recommended products, and a 33% reduction in homepage browsing as measured by product views (PV). The combined effect resulted in a substantial 81% decline in customer purchases (gross merchandise volume, GMV) facilitated by homepage recommendations.
Lesson: personalized recommendations are worth high double-digit % lifts.
Netflix' movie image personalization
In their blog post titled Selecting the best artwork for videos through A/B testing Netflix describes how the artwork or images associated with movies or television shows significantly influence a user's decision on what to watch. To provide the best personalized user experience, Netflix decided to conduct an A/B test on its artwork in different regions to understand the kind of images that resonated with its diverse user base.
One of the more notable findings was that images featuring expressive facial emotions of the main character had more appeal. For example, in one A/B test, Netflix used different thumbnails for the movie "Good Will Hunting." The artwork with Robin Williams showing a strong emotional expression drove more views than artwork with other characters or less expressive faces. However, Netflix didn't release the specific numeric outcomes of these tests, but they were confident in stating the effectiveness of this approach in increasing engagement.
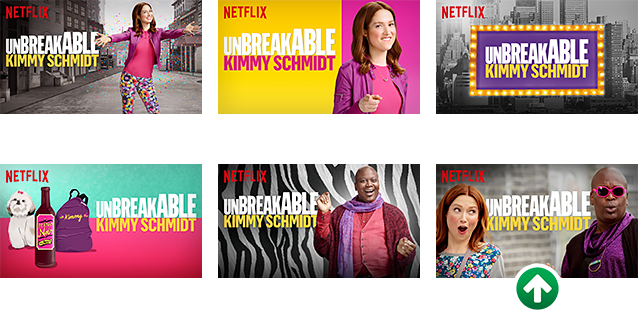
Following these A/B tests, Netflix has implemented a dynamic system that personalizes the artwork shown to individual users based on their viewing history and preferences. For instance, a user who watches a lot of romantic movies might see artwork emphasizing a love story, while a user who frequently watches action films might see artwork highlighting an action scene. This A/B testing has allowed Netflix to optimize user engagement, personalize content more effectively, and drive longer viewing sessions.
Lesson: personalization and experimentation opportunities lurk in unexpected areas.