Getting Started with MLFlow
Marton Trencseni - Sun 10 January 2021 - Data
Introduction
For the last few months I’ve been using MFlow in production, specifically its Tracking component. MLFlow is an open source project for lifecycle tracking and serving of ML models, coming out of Databricks. MLFlow is model agnostic, so you can use with SKLearn, XGBoost, Pytorch, Tensorflow, FBProphet, anything. The best way to get an initial understanding of MLFlow Tracking is to watch the first 25 minutes of this talk by Corey Zumar, who works on MLFlow at Databricks.
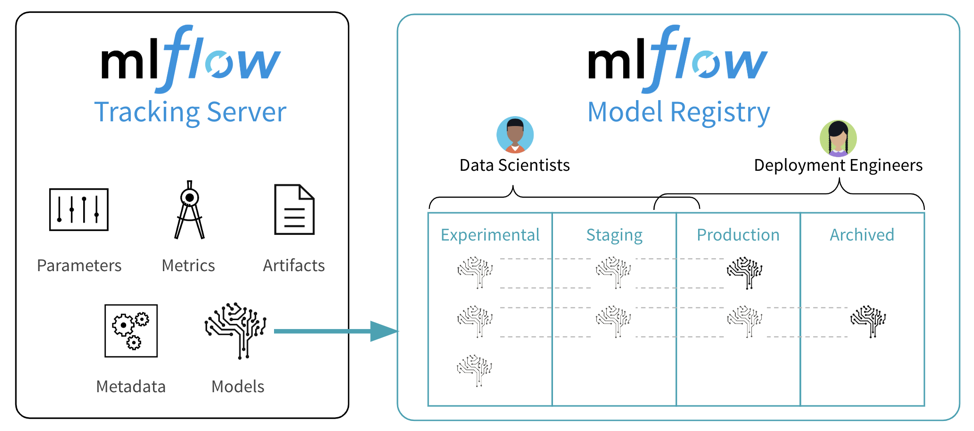
MLFlow Tracking is a simple client/server solution to log, track and share model metrics at scale. Using MLFlow makes sense both during the development of the model and also once the model is running in production.
Using MLFlow for model development
In this scenario, I’m using an ipython notebook and iterating on a model. I’m either reading training data from a files or straight from the database, training models, evaluating on test data, rinse and repeats potentially 100s of times, over days, weeks or months. With MLFlow, I can continuously track various metrics and artifacts of my models runs, such as:
- the current source code for the model training/running
- size/shape of the data I'm using for training
- various metrics and distributions of the training and test data
- model runtime and memory usage
- goodness metrics such as accurary, f1 score, precision, recall, TPR, FPR, etc.
- various plots such as ROC
With MLFlow I achieve a kind of raw versioning of my model development.
Using MLFlow in production
In production can mean several things:
- Some models are batchy, and are re-trained at pre-specified intervals (eg. hourly, daily or weekly) on new data, and then emit their prediction for existing data into a table, which is then read out by other processes.
- Other models are re-trained at regular intervals like above, but then serve prediction requests in real-time, eg. over an HTTP API.
- In advanced use-cases models are also updated in real-time as new training data comes in, but this is not typical outside of advanced Internet companies.
MLFlow Tracking is agnostic to the above, so it can be used in all scenarios. Personally I'm using it in scenario #1 use-cases so far, from Airflow.
Setting up MLFlow and the artifact gotcha
Setting up MLFlow is easy. Just create a new venv and pip install mlflow. You will need to pip install mlflow on both the server and all the clients that will be emitting tracking metrics to MLFlow. Remember that you can !pip install mlflow from ipython notebooks.
Now, we can start the server, like:
mlflow server --backend-store-uri XXX --default-artifact-root YYY -h 0.0.0.0 -p 5000
What is backend-store-uri and default-artifact-root?
We will use MLFlow for storing metrics like accuracy, essentially in a flat key-value manner. It will store these in the backend store, which can be a filesystem location or a database like Postgresql. We will also send files to MLFlow for tracking, such as the source code currently running, or a plot we generated (eg. an ROC curve). These will be sent and stored as files under artifact root**, which has to be a filesystem or an S3 bucket.
The big gotcha is that the MLFlow client library:
- when sending metrics, it sends those to the MLFlow server, which stores them in the backend store; the client does not access the backend store directly
- when sending artifacts, the MLFlow client library puts them directly into the artifact store, so both the client and server needs to have access to it! This is very unexpected because it goes against basic client/server principles. For this reason, although you can start up MLFlow by specifying a directory on the server as the artifact root, client calls to save artifacts will fail. You need to specify something like an S3 bucket, and both the client and server needs an AWS access key to read/write!
I have set up MLFlow to use the server's local filesystem for backend store and a shared (between server and clients) S3 bucket for artifact storage.
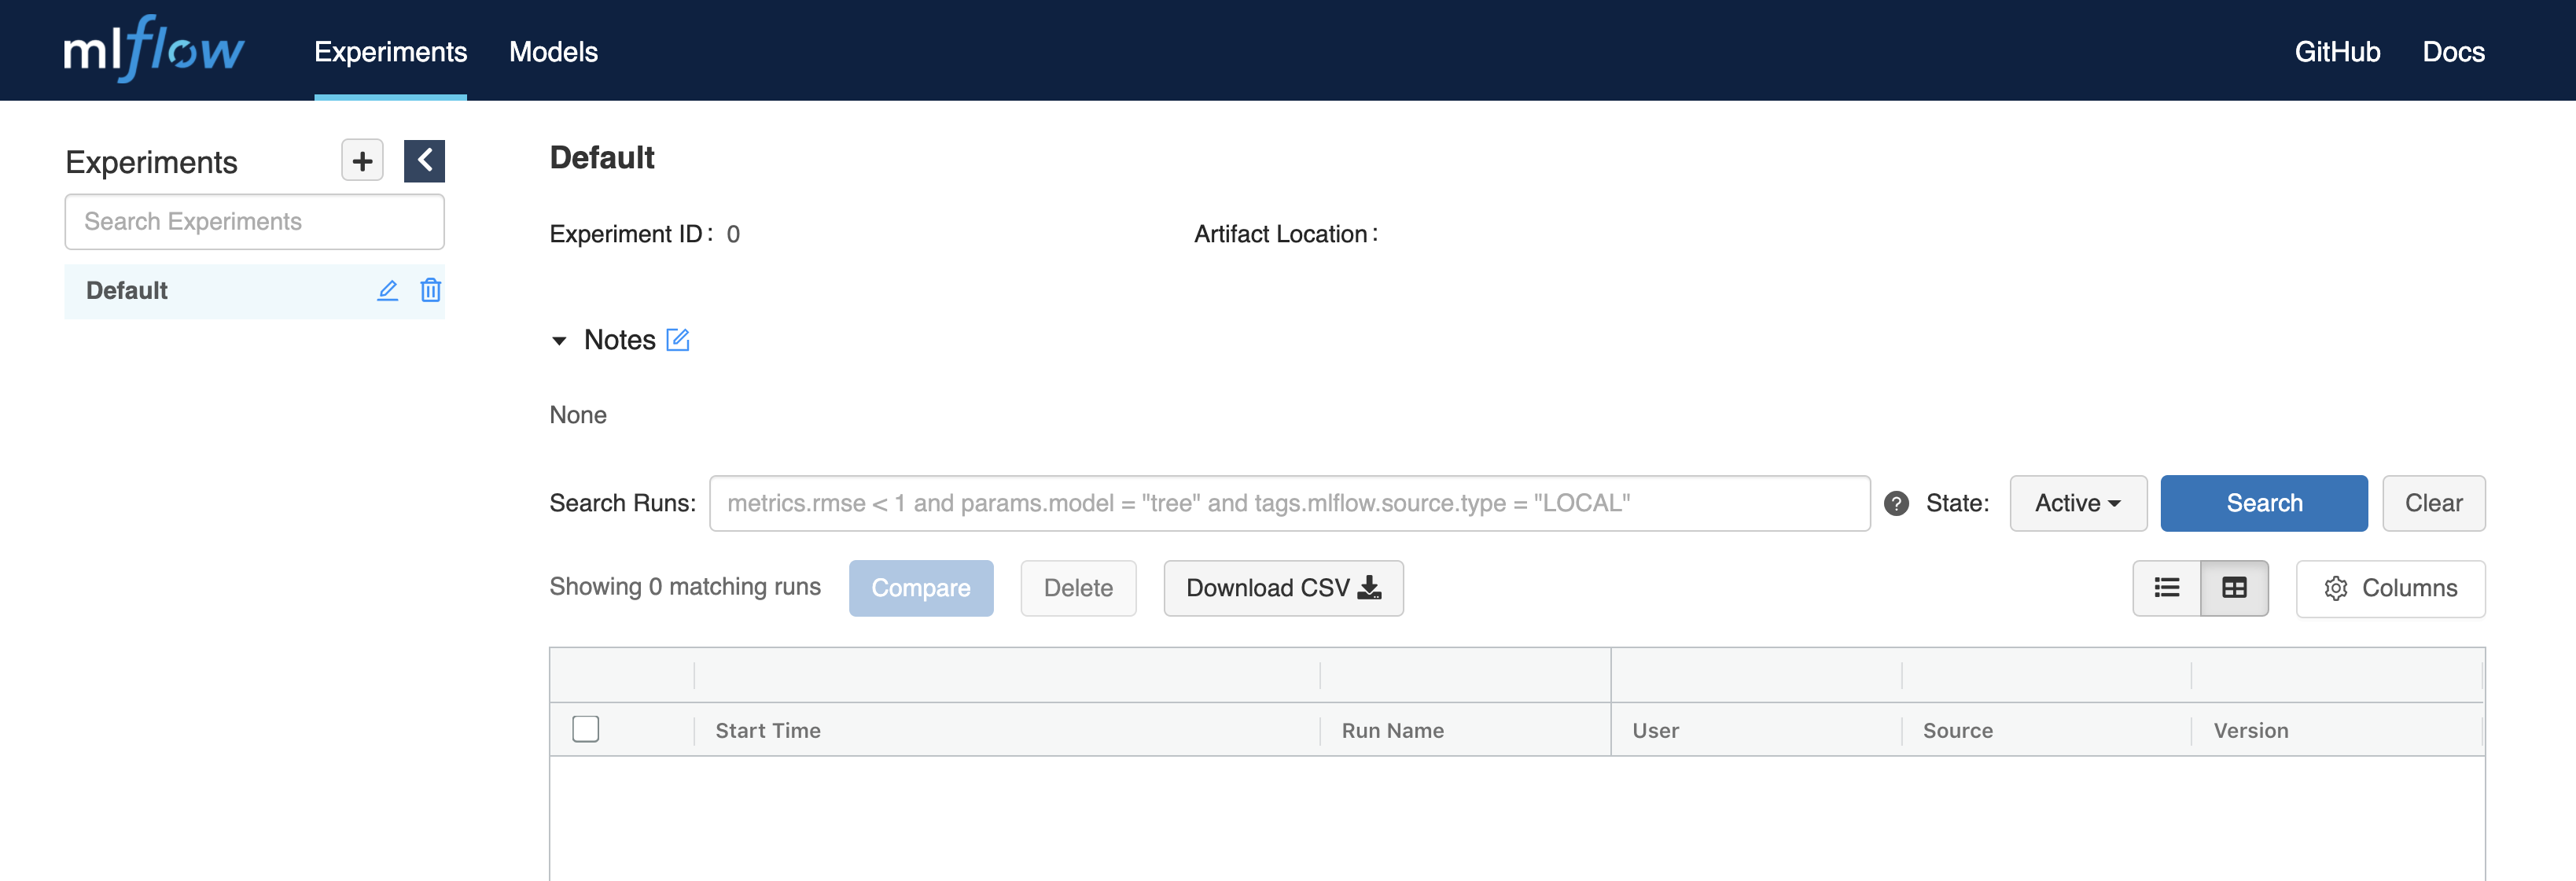
Once the server is up and running, you can open it in your browser, you should see an empty page like this:
Sending tracking data to MLFlow
Now we can send tracking data to the MLFlow server. Fundamentally the steps are:
- set up a connection
- set the experiment; if the experiment doesn’t exist, it will be created automatically (the experiment is essentially the project you’re working on)
- open a new experiment run
- log params, metrics and artifacts
- check the results on the web console!
In code:
import os
import mlflow

mlflow.set_tracking_uri('http://127.0.0.1:5000')  # set up connection
mlflow.set_experiment('test-experiment')          # set the experiment
with mlflow.start_run():                          # open new experiment run
        mlflow.log_artifact(os.path.abspath(__file__), 'source code')
        mlflow.log_param('some parameter', 1)
        mlflow.log_metric('accuracy', 0.9)
The experiment test-experiment will show up on the web console:
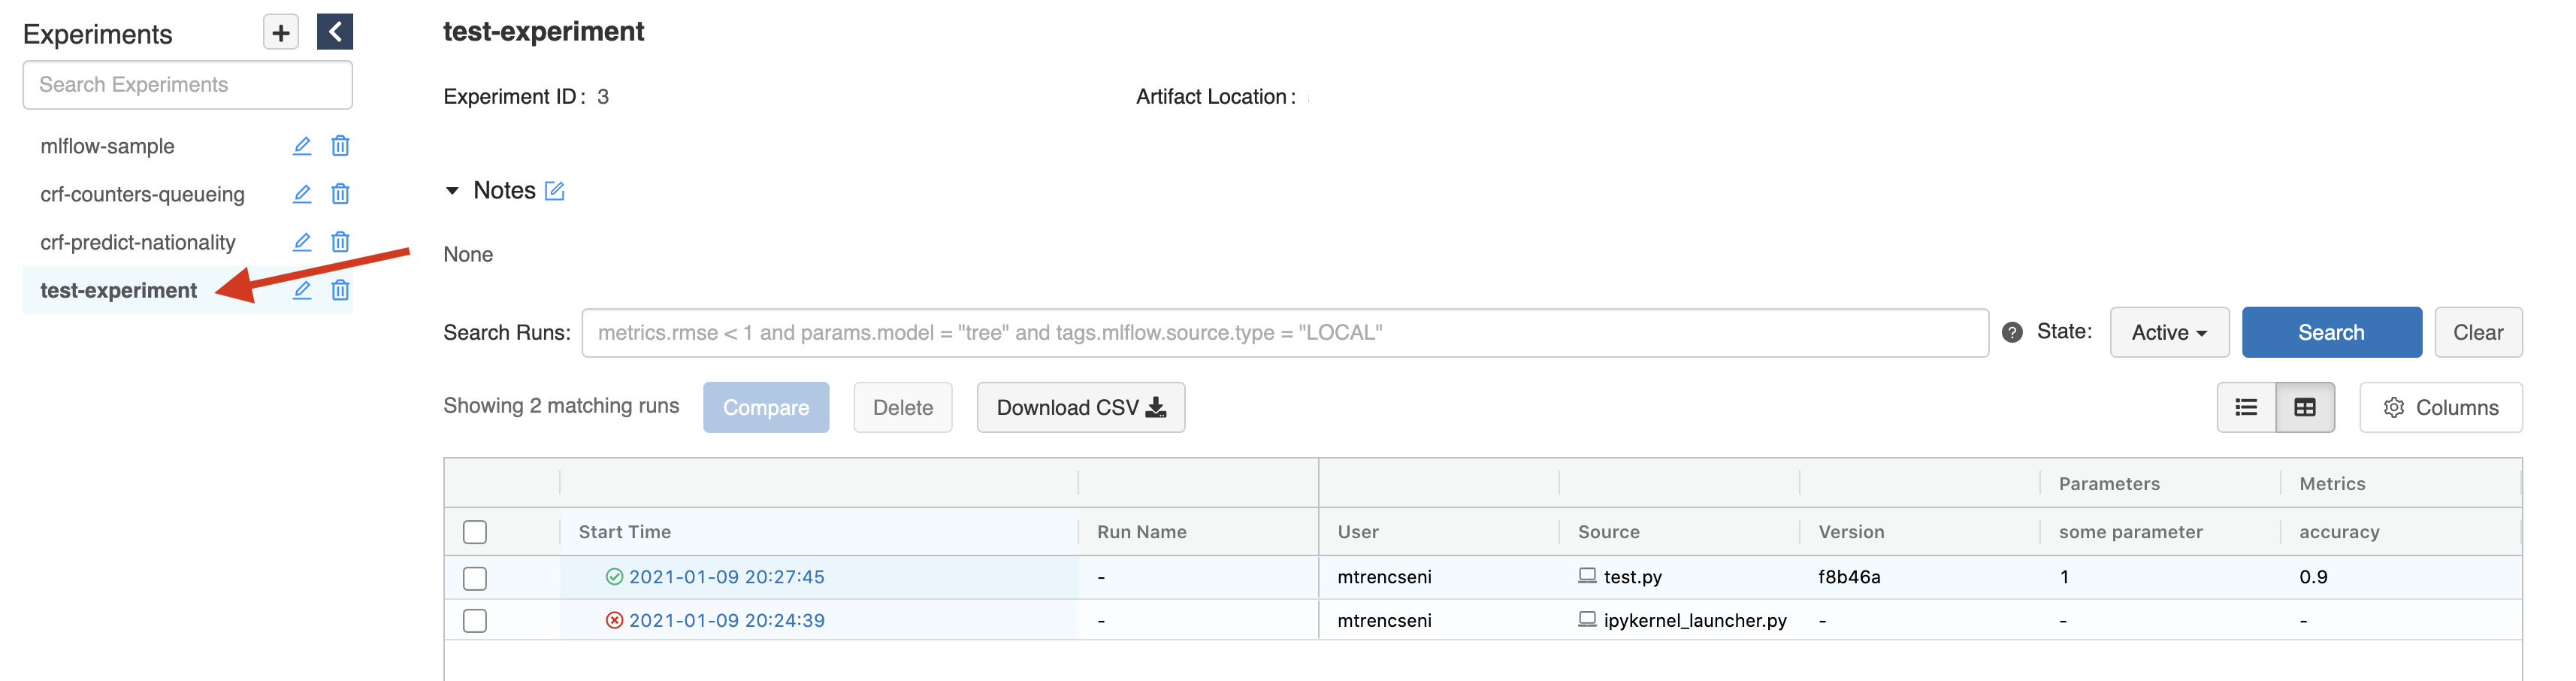
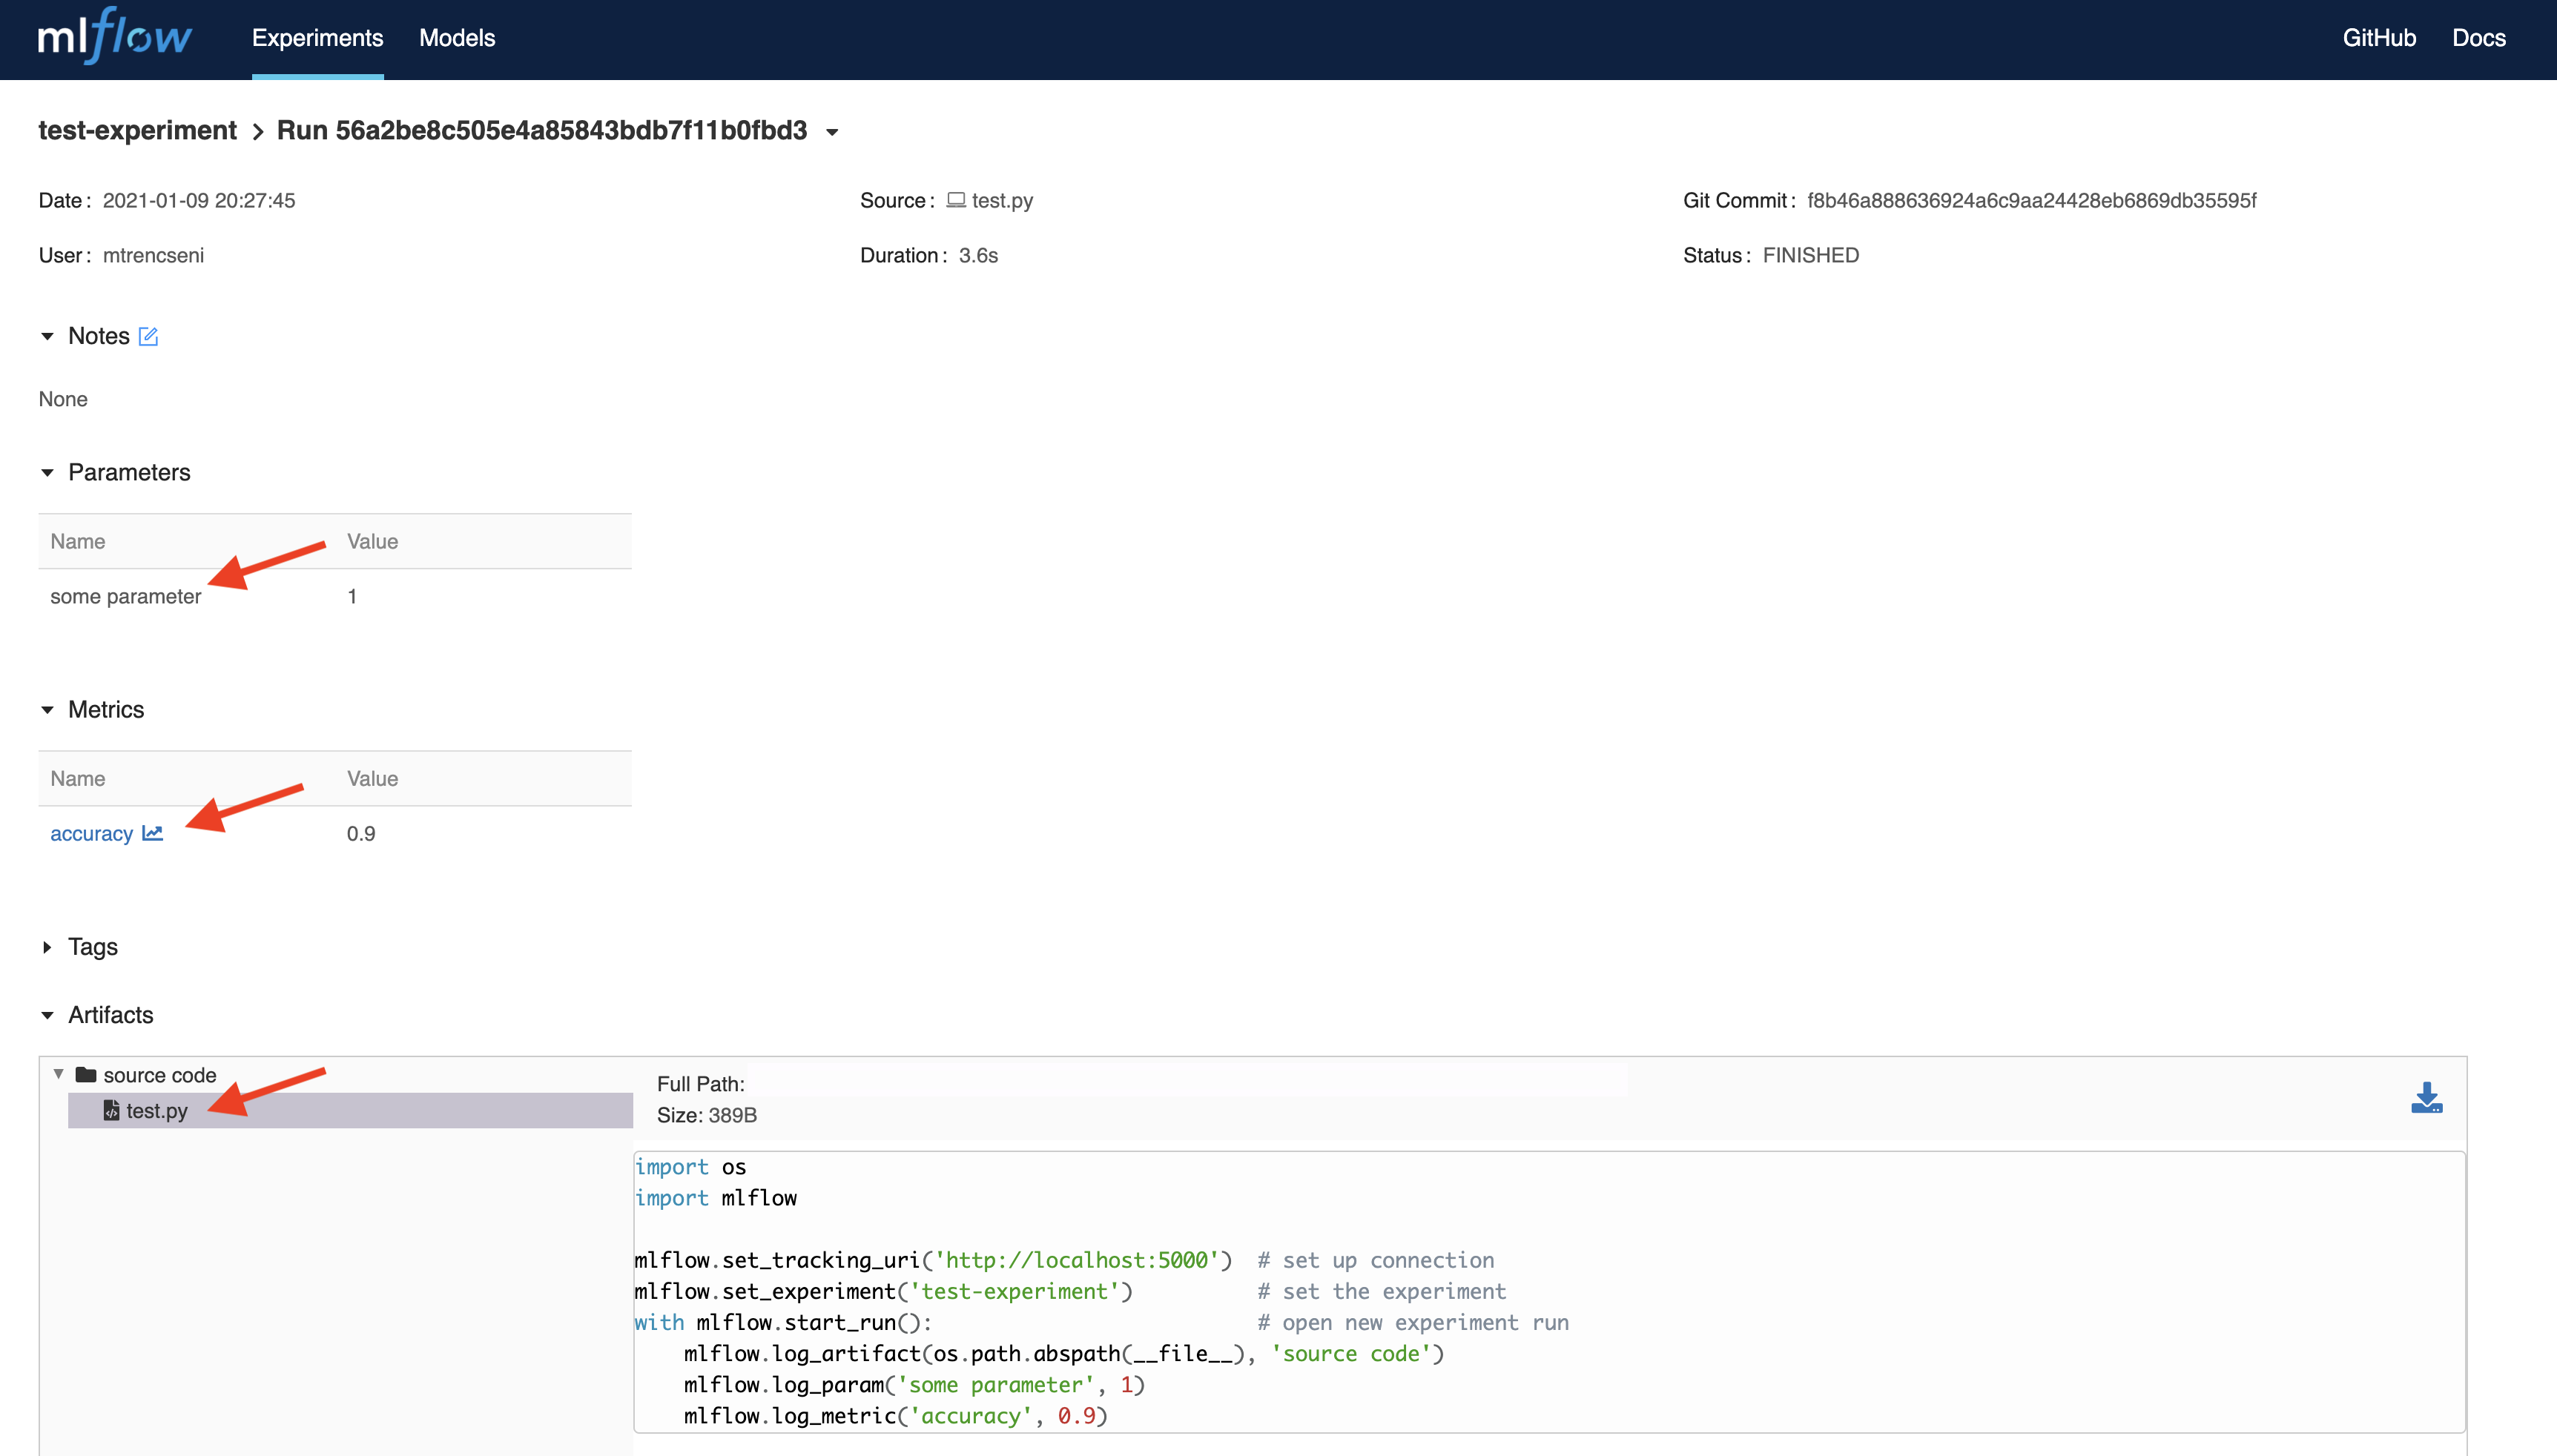
Inside the experiment are the experiment runs. Selecting the latest one we will see our logged data:
Conclusion
This was a quick introduction on how to set up MLFlow and how to get some initial data into it. Surprisingly, there is not much more handholding that you will get from MLFlow. Although there is experimental integration of MLFlow into common ML libraries such as SKL (mlflow.sklearn), Pytorch (mlflow.pytorch) and many others, most of the relevant metrics for your model you will have to log manually using the functions above: log_artifact(), log_param(), log_metric(). For example, to save an ROC curve, you will have to generate the plot using pyplot, save it to a .png file, and then save that file as an artifact. In later posts I plan to discuss useful patterns for MLFlow.
Happy MLFlowing!