"Over 70% of all Porsche vehicles ever built are still on the road today"
Marton Trencseni - Sat 30 April 2022 - Porsche
Introduction
In 2021 November I went to a Porsche event in Dubai called Icons of Porsche. It was a very cool (free) event, where 100s of iconic Porsche cars were on display, both from local owners, and also many transported from the official Porsche museum in Stuttgart for this event! Near the entrance of the event I snapped this picture:

This has been tingling my curiosity ever since. Is this a testament of the quality and longevity of Porsche cars, or simply a result of the brand switching from niche sportscar manufacturing to mass production around the year 1999?
For those who don't know much about Porsches, the brand exploded when the company started to manufacture less expensive and more practical cars around 2000:
- Cayman/Boxster (2 seater), introduced in 1996
- Cayenne (big SUV), introduced in 2003
- Panamera (wagon), introduced in 2009
- Macan (small SUV), introduced in 2014
- Taycan (electric), introduced in 2019
The iconic Porsche 911 also had a significant switch in 1998. Models before this were air-cooled, models after were water-cooled. The air-cooled 911s are much more of a collector's item than the later generations. Also, the first water-cooled 911, the 996 had the famous broken-egg shaped lights, which many enthusiasts (including me) find ugly. The 996 and later models are not considered collector's items, while the previous generations, including the last air-cooled 993, are. If you remember the original Bad Boys movie (with Will Smith and Martin Lawrence), he famously drove a black 993 generation 911 Turbo. That exact car happened to be on display at the Mall of Emirates a few years ago, where I snapped this picture:

So the question is: is the seemingly high 70% statistic because a lot of Cayenne/Macans were built in the last 15 years, and these cars simply haven't had time yet to die? Or do Porsche cars in fact have a relatively long lifespan?
The ipython notebook is up on Github.
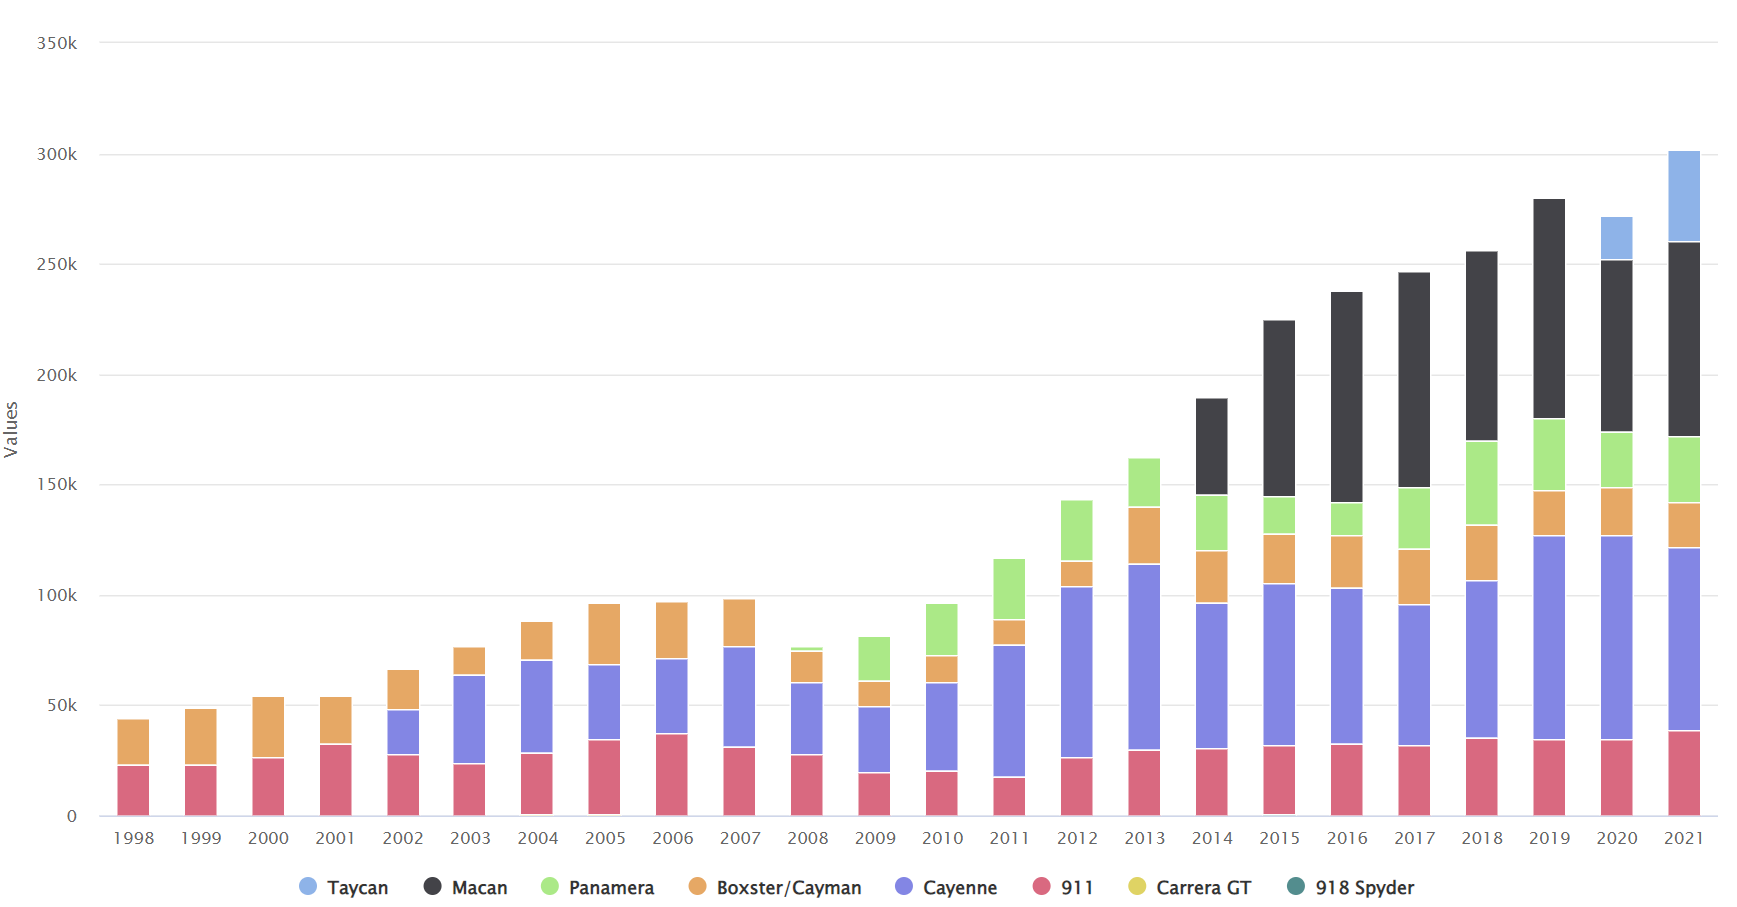
Porsche production timeseries
This page has annual production numbers from 1998 to 2021. Scrolling down there is also a break-down by model, this shows that the sportscar segment (911, Cayman) hasn't grown much, the growth is coming from the "practical" segment (Cayenne, Macan, Panamera).
This official Porsche page has some scattered annual and cumulative production numbers for the preceeding 50 years. These are:
- 1947: 0 produced
- 1948: 52 produced that year
- 1956: 10,000 total produced up to this year
- 1963: 11,000 produced
- 1969: 14,000 produced
- 1977: 300,000 total produced up to this year
- 1996: 1,000,000 total produced up to this year
I wrote a quick function to compute a piecewise linear fit given these constraints (it's not a simple fit, since the "integral" is also involved):
Number = Union[float, int]
TimeSeries = Sequence[tuple[int, Number]] # type alias

def piecewise_linear_fit(f: TimeSeries, c: TimeSeries) -> TimeSeries:
    # compute a piecewise linear fit to f, also taking
    # into account the cumulative sum constraints in c
    r = [f[0]]
    fi, ci = 1, 0
    while True:
        if ci >= len(c) and fi >= len(f):
            break
        elif ci >= len(c) or f[fi][0] <= c[ci][0]:
            # the next closest data point is in f, use that to get the slope
            slope = (f[fi][1] - r[-1][1]) / (f[fi][0] - r[-1][0])
            to = f[fi][0]
            fi += 1
        elif fi >= len(f) or f[fi][0] > c[ci][0]:
            # the next closest data point is in c, use that to get the slope
            ts = range(1, c[ci][0] - r[-1][0] + 1)
            slope = (c[ci][1] - sum([t[1] for t in r]) - r[-1][1]*len(ts)) / sum(ts)
            to = c[ci][0]
            ci += 1
        (x_0, y_0) = r[-1]
        for x in range(r[-1][0]+1, to+1):
            r.append((x, y_0 + slope * (x - x_0)))
    return r
Note that given that we're doing a simple survival analysis, the shape of the curve in the 20th centure won't matter much, and one of the last cumulative constraints is at 1996 anyway.
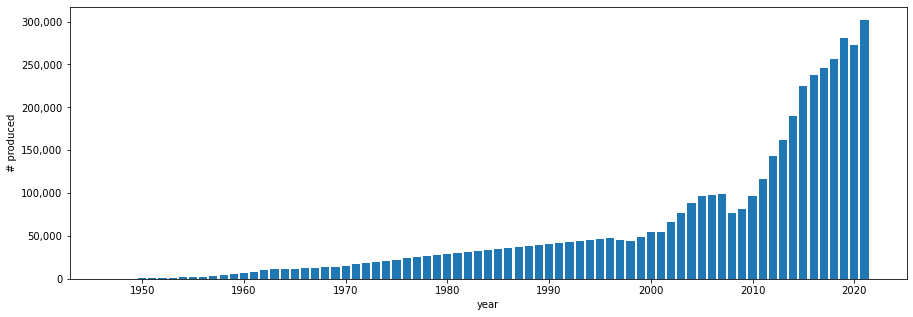
Running this, we get the following fit for the annual production curve from 1948 to 2021:
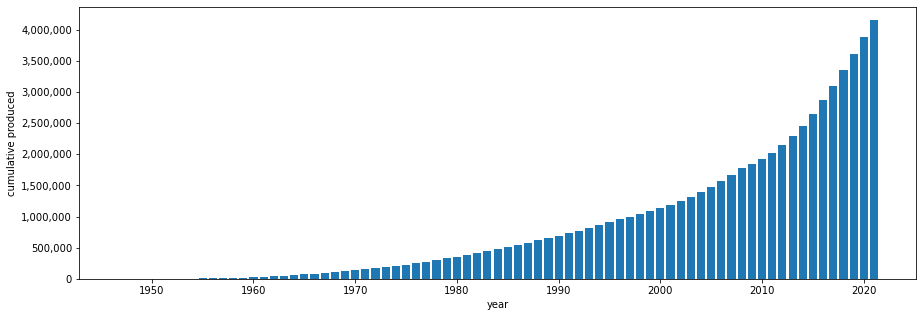
Same, but showing cumulatives:
Naive survival
First, let's do a naive survival model. Let's assume that cars are manufactured, are alive for lifespan years, and then they die:
def ratio_alive(f: list, lifespan: int) -> float:
    total = sum(f)
    alive = sum(f[-lifespan:])
    return alive/total

ds = []
for lifespan in range(10, 25):
    r = ratio_alive([x[1] for x in f], lifespan)
    ds.append((lifespan, r))
    print(f'{lifespan} -> {r:.3f}')
Output:
10 -> 0.519
11 -> 0.545
12 -> 0.567
13 -> 0.585
14 -> 0.603
15 -> 0.625
16 -> 0.647
17 -> 0.668
18 -> 0.688
19 -> 0.705
20 -> 0.720
21 -> 0.733
22 -> 0.745
23 -> 0.756
24 -> 0.766
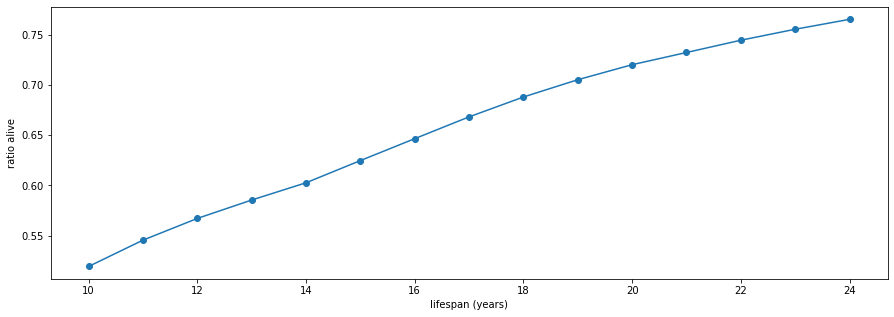
We can read off the output that in this simple model, we have to assume a lifespan of 19 years to get a 70% survival rate for today.
Monte carlo survival
The above gives a good initial indicator, but it's too naive even for a naive model. The problem is, even if we say that it suggests an average lifespan of 19 years, it's biased. Old cars (eg. produced in 1975), even if their lifespan is off from the average, by 2021 most will have died. But for recent cars, we could get early deaths probabilistically, which would drive down the survival rate. Ie. if a car produced from 1975 dies at 5 years, it doesn't affect our survival rate in 2021, but if a car produced in 2015 dies "too early" in 2020, it does. So let's model the lifespan of the cars as a normal distribution centered around an average lifespan:
avg_lifespan, sigma = 20, 5 # years
total, num_alive = 0, 0
for (year, num_produced) in f:
    for _ in range(round(num_produced)):
        expiry_year = round(year + max(0, normal(avg_lifespan, sigma)))
        total += 1
        if expiry_year >= 2022:
            num_alive += 1
survival_ratio = num_alive/total
print(f'Assuming avg_lifespan = {avg_lifespan} years and sigma = {sigma}, survival % = {survival_ratio*100:.1f}')
Output:
Assuming avg_lifespan = 20 years and sigma = 5 years, survival % = 70.4
So introducing a normal distribution doesn't change the result much. It's worth noting that an increasing sigma with a fixed average lifespan yields a lower survival %. So if we assume a 10 year sigma, to get 70% we'd have to assume an average lifespan of 22 years.
We can also try to divide the cars into a classics vs mass-produced, by assuming cars before 1999 are classics, and after are mass-produced, and using two separate normal distributions for their lifespans. Here we can play around with the assumption that the classic cars get a lot of care and loving, don't get driven much, and hence have very long lifespans, while the mass produced cars have lower lifespans:
# avg_lifespan_classics, sigma_classics = 33, 10 # years
# avg_lifespan_massprod, sigma_massprod = 15, 5  # years
avg_lifespan_classics, sigma_classics = 25, 10 # years
avg_lifespan_massprod, sigma_massprod = 17, 5  # years
classics_year_end = 1999
total, num_alive = 0, 0
for (year, num_produced) in f:
    for _ in range(round(num_produced)):
        if year < classics_year_end:
            expiry_year = round(year + max(0, normal(avg_lifespan_classics, sigma_classics)))
        else:
            expiry_year = round(year + max(0, normal(avg_lifespan_massprod, sigma_massprod)))
        total += 1
        if expiry_year >= 2022:
            num_alive += 1
print(f'Assuming avg_lifespan_classics = {avg_lifespan_classics} years and sigma_classics = {sigma_classics} years')
print(f'Assuming avg_lifespan_massprod = {avg_lifespan_massprod} years and sigma_massprod = {sigma_massprod} years')
print(f'Survival % = {survival_ratio*100:.1f}')
Output:
Assuming avg_lifespan_classics = 25 years and sigma_classics = 10 years
Assuming avg_lifespan_massprod = 17 years and sigma_massprod = 5 years
Survival % = 70.4
Of course there are lot of parameter choices of the 4 four parameters (2 averages, 2 sigmas) that yield a 70% survival rate. But taking all 3 versions into account, it suggests that modern Porsches have a 15-20 year average lifespan, which does sound pretty good. Google suggests that the average car's lifespan is 8 years.
Conclusion
The analysis is quite naive, but because all 3 models were in roughly the same range, I think the conclusion of modern Porsches having a 15-20 year average lifespan is directionally sound. Having said that, some caveats and comments:
- Lifespan in itself is not just a property of the car/brand, it's also a function of the owners. Many Porsche owners love their cars and take good care of it, which increases their lifespans (compared to a Suzuki). Also, for similar reasons many Porsche cars don't get driven as many miles as other brands, which reduces opportunities for the car to die.
- Even if a car brand has good reliability and owners take care of it, if it's been mass producing cars for a long time, the survival rate would be significantly lower. For example, the Ford Motor Company has been mass producing cars since 1901.
- Lifespan is not necessarily related to low fault rates. In my experience, Porsche cars have just as many issues (or more) as other similar brands (BMW, Land Rover/Jaguar). Official statistics are in disagreement, some suggest Porsches are reliable, other suggest it's below-average.
- Here lifespan-in-years was the primary input metric, but a better analysis would also take into account lifespan-in-miles.
- I don't know how realistic a normal distribution is for modeling the lifespan, I didn't research how cars die. The sigmas don't seem to matter much.
- Doing a per model (eg. Macan, Cayenne, 911, etc) model doesn't seem to be worth it, since already the classic vs. mass-produced had too many parameters.