A/B tests: Moving Fast vs Being Sure
Marton Trencseni - Mon 01 July 2019 - ab-testing
The basic flow of an A/B test (in a frequentist setting) is roughly:
- formulate a hypothesis ("sending additional notifications will cause people to be available for deliveries")
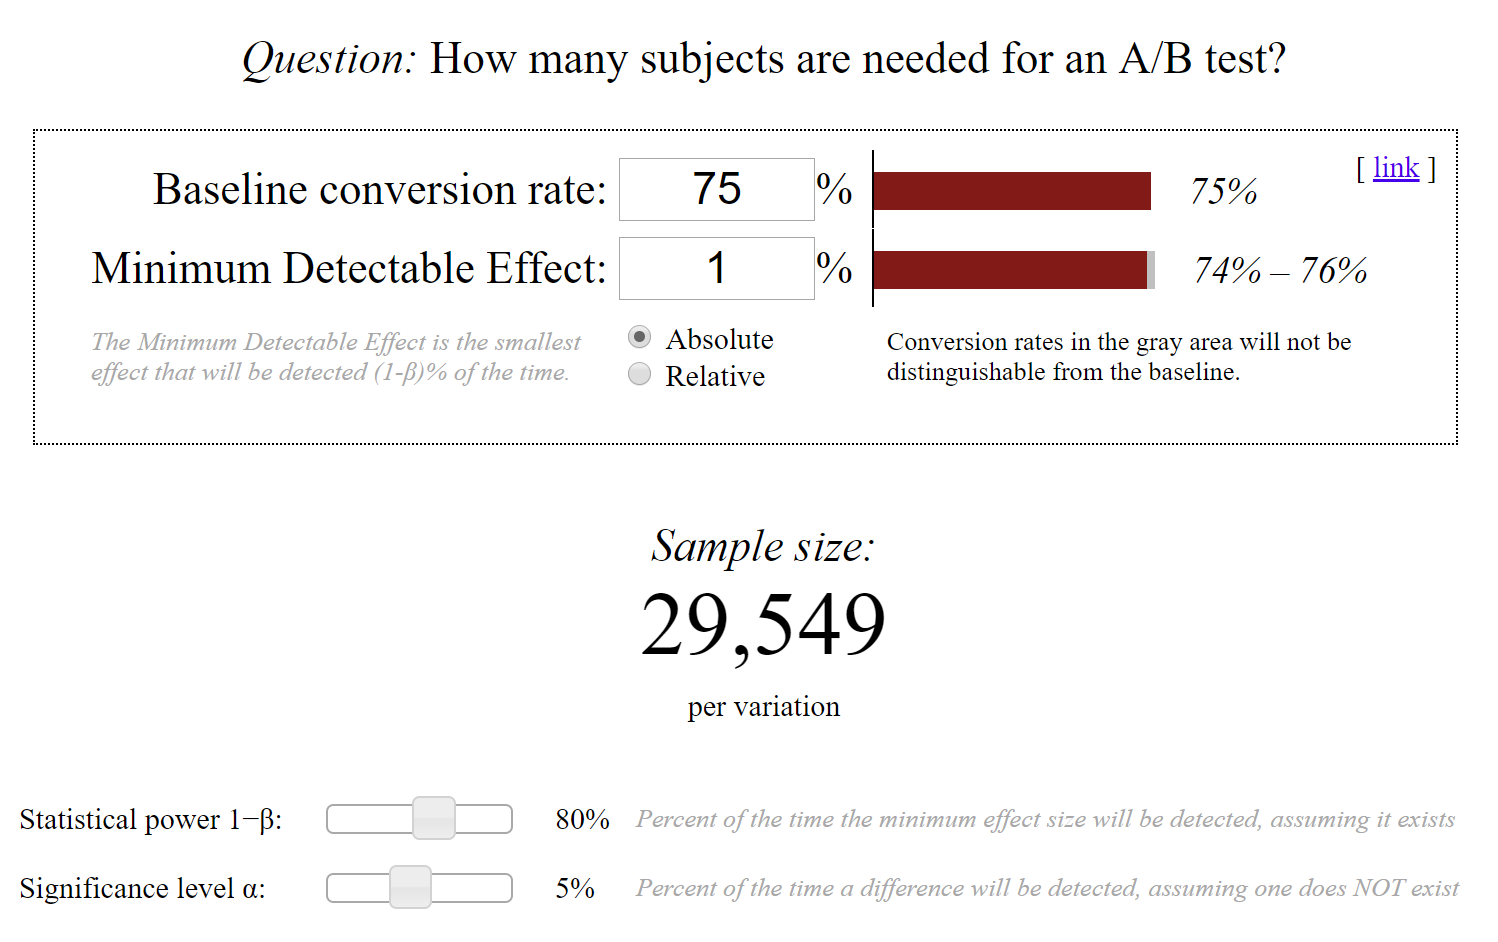
- select a target metric ("Delivery Performance = Deliveries/Dispatches") and specify the base value ("75%")
- estimate the lift on the target metric ("1%")
- use an off-the-shelf A/B testing tool to figure out how many N samples you will need, given the base metric value and expected lift
At this point, in the A/B testing tool, there are 2 magic parameters that the Data Scientist has to set for the Chi-squared test:
- α: also called sensitivity, the probability that, if the experiment goes off, the effect is actually not there (False Positive Rate, FPR)
- 1-β: also called power, the probability that, if the effect is there, the experiment will go off (True Positive Rate, TPR)
Most tools will default α=0.05 and 1-β=0.8, which is a sensible default. With these, the A/B testing tool will tell the Data Scientist how many N samples she needs to collect per variant (control and test) to be able to detect the given lift (1%) from the base value (75%), with the specified statistics (FPR, TPR).
By pushing down the FPR, we can increase our confidence in our results. More power will enable us to catch more working experiments. But there is no free lunch, we will need to collect more N samples for this. So what is a good trade-off here? Almost all tools default to the values above, but there is nothing special about them.
The reason I started thinking about this is that in a startup setting, when there are low volumes [for the subset we're testing, eg. a specific city for a delivery company], it takes a lot of days to collect the N samples, which slows down the product development velocity. This is essentially a management concern: if A/B testing is seen by management to be a burden that slows things down, then it won't happen, which is a net loss. Often I feel that it's probably fine to run at α=0.1 or even α=0.2, or, in other words, to accept higher p-values as statistically significant; being wrong 20% of the time is not too terrible in a startup setting when no lives are at stake (ie. we're not experimenting with new drugs).
So let's try to quantify this with a toy model:
- We continue with the assumptions above: base metric = 75%, expected lift = +1%.
- Let's look at three different scenarios, α=0.05, α=0.10 and α=0.20.
- We use Evan Miller's A/B testing sample size tool to read off the N samples required.
- At higher α, we need less N, so we can run more experiments, that's the point (but we will get more false positives, FPs).
- We continuosly run experiments for 365 days.
- Let's assume that 1 in 4 experiments actually yield a hit, which results in the desired +1% lift.
- Let's estimate the $ value of a hit at $100,000 (we realize this on true positives, TPs),
-
Let's estimate the cost of a rollout at $25,000 (we incur this cost on both TP and FP hits).
-
This is what the three scenarios look like, annualized for easy readability, the spreadsheet is here:
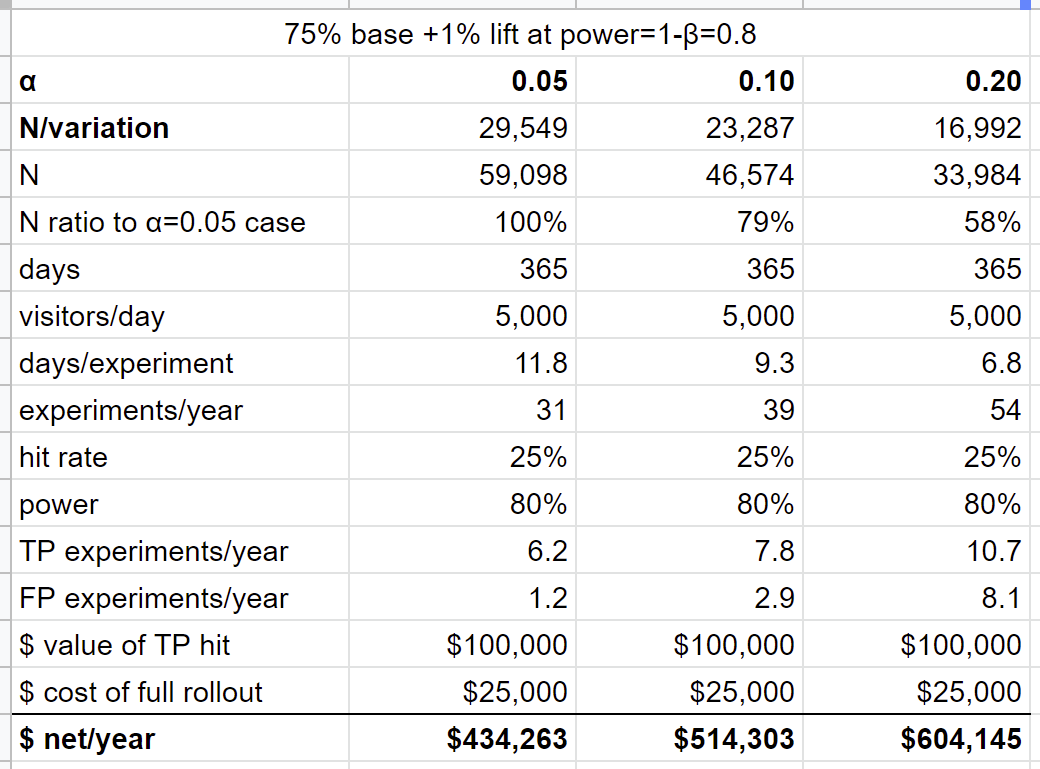
In this base scenario, with these parameters, running at high α is better. It yields more experiments, because we need less sample size, so we will find more hits, and even though we incur more false positives, it's still worth it. As we increase the cost of the rollout, this benefit goes away, as the cost of rolling out the FPs eats up the value generated by the TPs. Having said that, I think this scenario applies in many startups: moving fast over being sure is worth it.
Let's add one parameter to the toy model. Suppose there is a cost to running an experiment, $10,000/experiment. This essentially means that there is a cost to "moving fast" (new parameters highlighted in blue):
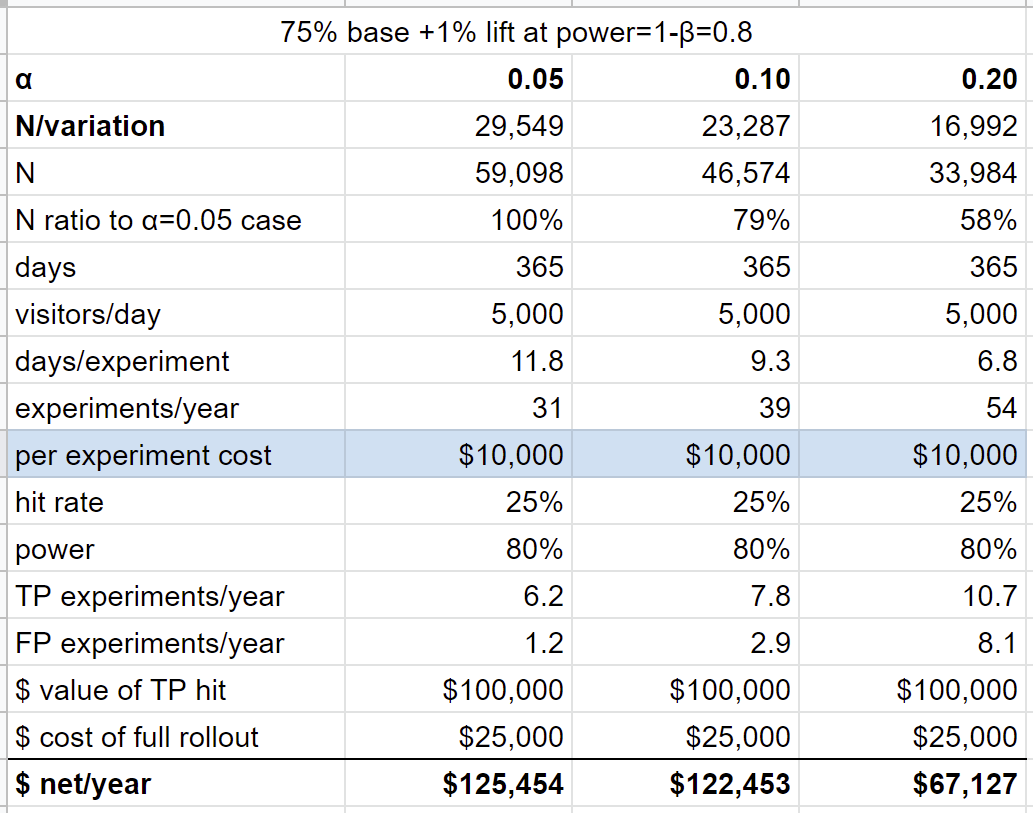
In this scenario, α=0.05 is the better choice. When we move fast at higher αs, we lose more on running and rolling out our FPs than we gain by finding more TPs.
Let's try another one, where we add a loss, ie. 50% of our false positives actually make things worse, and in this case we incur a loss of $50,000 (new parameters highlighted in blue):
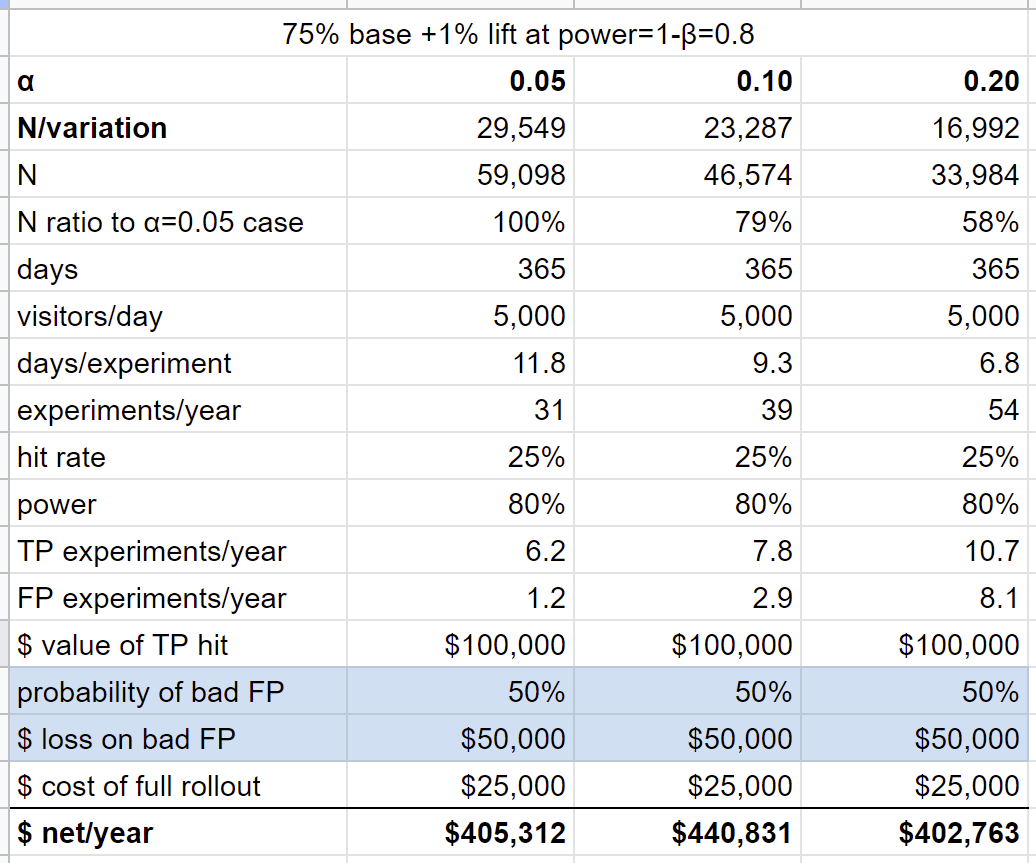
In this case, α=0.10 is the better choice, but it's pretty close.
Let's combine the two, and have both cost and loss:
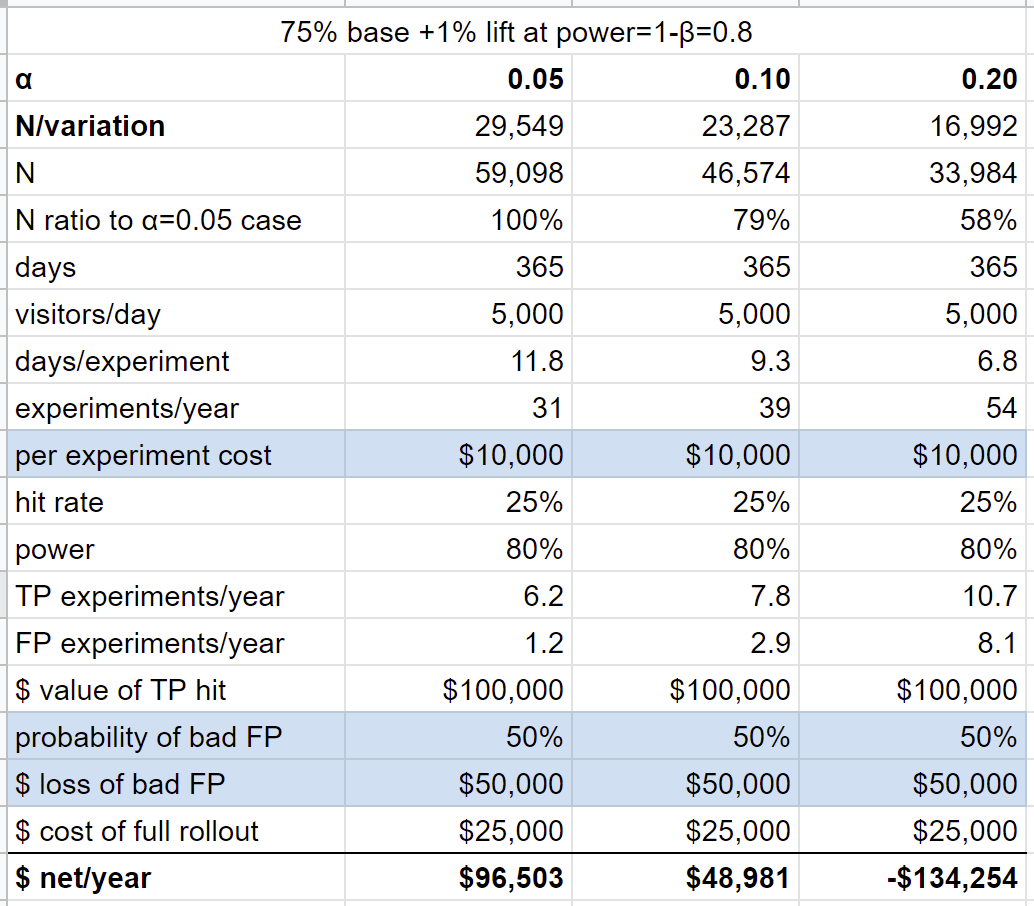
In this scenario, we're better off being sure and running at α=0.05, running at α=0.20 would actually cause the startup to lose money (not to mention the salary of the Data Scientist!).
As these simple toy models show, it does make sense to increase α, the accepted false positive rate, in some situations. For example, at my current company the base case is the closest to reality, except the value of a hit is even higher and the rollout cost is even lower (and the likelihood of a loss on a FP is low, sending more notifications is unlikely to yield less likely availability for delivery when our driver shows up).
Having said that, there are valid counter-arguments to running at high α (accepting higher p-values):
- less certainty (higher FPR) could diminish the organizational belief in experimental results and A/B testing
- can a startup come up with enough experiments to justify a higher α?
- can a startup roll out all those (TP and FP) hits, is the velocity of the Product and Engineering team high enough?
Fortunately, building a spreadsheet like this takes less than an hour, so everybody can make up their own mind, weigh the pros and cons of statistical and management aspects, and find a trade-off in (α, β) parameter space which works for them!