Validation checks for A/B tests
Marton Trencseni - Thu 16 April 2020 - Data
Introduction
"Anything that can go wrong will go wrong", according to Murphy’s law. A/B testing is no different. Anybody who has run a lot of A/B tests, over several years, has seen multiple failure modes. Some errors I've seen (assuming “B” is the new experimental funnel in the A/B test):
- misconfigured test: we want to do a 20%-80% split, but we accidentally configure 80%-20% split instead
- accidentally still running: we conclude the test, and want to remove A or B from production, but accidentally leave the test on with the original traffic split
- randomization bias: users are not assigned into A and B randomly
- logging problem: no/less/faulty logs coming from B
- buggy product: a software bug in B causes users to drop out
Let’s look at how we can automatically catch some of these problems. Note that in all of the tests below, we are doing a two-tailed test, we want to catch deviations in either direction.
The code shown below is up on Github.
Problem: misconfigured test, missing exposure logs
This is the easiest to catch, assuming we have an independent validation system that is correctly configured. On the one hand, if this is the case, we can simply write code that checks whether the configured traffic splits match in production vs validation. However, this is often not possible, because eg. the production configuration is hardcoded into Python or Java source code files.
In this case, we can perform validation on the exposure logs. Exposure log just means a log entry which is generated when a user is assigned into the funnels A or B. We can do a check using the one-way $\chi^2$ test: if we expect an 80%-20% split between A and B (were 80-20 is typed a second time in the validation check), we can check how likely it is that the exposure log counts for A and B are coming from that distribution. If there is a misconfiguration, we will get a very low p-value, and can alert on it:
N=10*1000
traffic_split = [0.8, 0.2]
user_counts = [1987, 8013] # bad
#user_counts = [8013, 1987] # good
# simulates a case where we accidentally switched A and B
# so the test would return a very low ~0 p value, indicating
# that it's very unlikely that the observed counts are coming from
# the indicated traffic_split
p = chisquare(user_counts, f_exp=[N*s for s in traffic_split])[1]
if p < p_crit:
    print('Low p value (%f). Probably badly configured test, or bad logs!' % p)
else:
    print('Everything seems good.')
For automation, use a very small critical p-value like 0.001 or 0.0001, since we’re not interested in statistical fluctuations, we want to catch misconfiguration, which will even at moderate sample sizes yield a very small p value, close to 0.
Note that here we’re not doing a significance test on the outcome of the A/B test. We’re just making sure the split is what we think it is. In the example above, we assumed that out of 10,000 impressions, 1,987 were in the A funnel, and it’s configured to get 80% of the traffic. The $\chi^2$ test that then tells us this is an extremely unlikely outcome. Note that the above $\chi^2$ test can be run for experiments with more than 2 funnels.
See my earlier post on the $\chi^2$ test.
Problem: randomization bias
Sometimes the software engineer who implements some of the A/B testing code isn’t math-savvy, and makes a simple mistake. For example, he may think that user_id % 2 == 0 is a good enough way to do a 50%-50% split.
Note: Another related fallacy is to use and re-use fixed buckets (10 buckets, user_id % 10), and use different buckets for different A/B tests. This is a problem for a number of reasons: it unnecessarily lowers the sample size, see this previous post on parallel testing. Also, this introduces bias, because we keep reusing the same groups of users, so if a previous A/B test influenced users in the first bucket in a certain way, we may still be measuring that effect in later, unrelated A/B tests.
This can be tested by running a $\chi^2$-squared test on the last digits (or last 2 digits) of the user_ids. The idea is simple: if the user_ids are truly random in A and B, we should see 10% of user_ids that end in 0, 1 ... 9 both in A and B. The below code simulates this check:
MAX_USER_ID=1000*1000
N=10*1000
traffic_split = [0.8, 0.2]
digits_to_test = 1

users_in_experiment = np.random.choice(MAX_USER_ID, N, replace=False)
start = 0
users_in_funnels = []
for s in traffic_split:
    end = start + int(s*N)
    users_in_funnels.append(users_in_experiment[start:end])
    start = end

p_min = 1
expected_split = [10**(-1*digits_to_test)] * 10**digits_to_test
for id_list in users_in_funnels:
    digit_counts = list(Counter([x % 10 for x in id_list]).values())
    expected_counts = [e * len(id_list) for e in expected_split]
    p = chisquare(digit_counts, f_exp=expected_counts)[1]
    p_min = min(p, p_min)
if p_min < p_crit:
    print('Low p value (%f). Probably indicated badly configured test, or bad logs!' % p)
else:
    print('Everything seems good.')
Problem: logging problem or buggy product
The kinds of tests we can run here are similar to the tests above. For example, if the product is buggy and the new dialog doesn’t load at all, we would see that with a test like in the first example, because logs would be missing for B.
Similar tests can be performed on properties (segments) of users. For example, we can look at the country of the user (US, Europe, Rest), browser (Chrome, Firefox, Edge/IE, Rest), platform (desktop, mobile) and make sure that the splits are the same. For example, if the browser split (Chrome, Firefox, Edge/IE, Rest) of users in A is (0.4, 0.2, 0.3, 0.1) and for B it is (0.5, 0.24, 0.24, 0.02) we can run a $\chi^2$-squared test (with counts) on the vector pairs to see how likely it is that they are coming from the same distribution; maybe our new B version doesn’t render correctly on all browsers, or there are performance differences.
Another thing we can do is to run the test for the final target metric (eg. conversion or timespent), and see if the difference is unusually large. As above, we can set an aggressive p-value like (0.001 or 0.0001) and alert on that. This test would go off if for example in one funnel due to a software problem it’s impossible to convert, or lots of users with a certain browser are unable to convert, so the the conversion number is unrealistically suppressed.
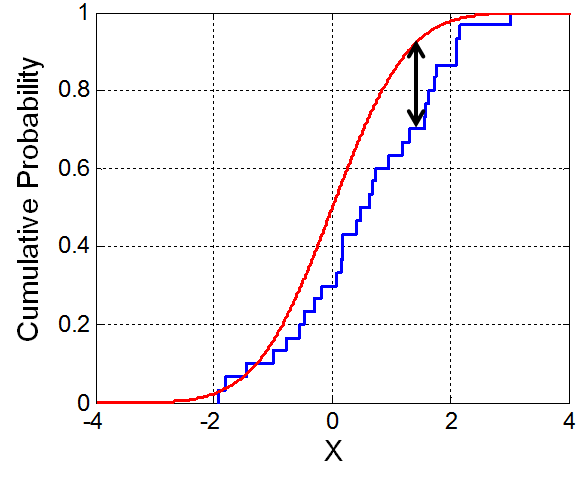
The problem with the above is that, at large sample sizes, which happens at companies with hundreds of millions or billions of users, even small lifts will be very significant, so achieve a low p value. In such cases a better validation check is to compare the distribution, assuming that most A/B tests don't change the distribution much, they just shift the mean; but a software or logging error might change the distribution shape, if we're "lucky". For this we can use the Kolmogorov-Smirnov test, which tests how likely it is that two samples are coming from the same distribution. The test statistic used by the Kolmogorov-Smirnov test is the largest difference in the cumulative probability distribution function.
Code, which notifies us that a uniform distribution is not normal:
N=10*1000
rvs1 = norm.rvs(size=N, loc=0, scale=1)
rvs2 = uniform.rvs(size=N, loc=-1, scale=2)
p = ks_2samp(rvs1, rvs2)[1]
if p < p_crit:
    print('Low p value (%f). It''s very unlikely the two samples are coming from the same distribution.' % p)
else:
    print('Everything seems good.')
Problem: accidentally still running
For this problem, the easiest sanity check is not statistical, it’s a consistency check in code/reporting:
- have a report of running A/B tests, which is based on exposure logs only, irrespective of whether the experiment is turned on or off in the experiment configuration tool
- have an alert, so that if an A/B test is turned off in the experiment configuration tool, but the experiment is still producing exposure logs, an alert is generated
In a good A/B testing culture, there is separate library/framework for running experiments in code. For a good example see Planout, an open-source framework released by Facebook. Here is the demo example from Planout:
from planout.experiment import SimpleExperiment
from planout.ops.random import *

class FirstExperiment(SimpleExperiment):
  def assign(self, params, userid):
    params.button_color = UniformChoice(choices=['#ff0000', '#00ff00'], unit=userid)
    params.button_text = WeightedChoice(
        choices=['Join now!', 'Sign up.'],
        weights=[0.3, 0.7], unit=userid)

my_exp = FirstExperiment(userid=12)
# parameters may be accessed via the . operator
print my_exp.get('button_text'), my_exp.get('button_color')

# experiment objects include all input data
for i in xrange(6):
  print FirstExperiment(userid=i)
Exposure logs should be generated in this line: my_exp = FirstExperiment(userid=12), when the user “enters the funnel” and the framework randomly decided on A or B.
Conclusion
A/B tests go wrong all the time, even in sophisticated product teams. As this article shows, for a range of problems we can run automated validation checks to catch problems early, before they have too bad of an effect on on customers or the business. These validation checks compare various statistical properties of the funnels A and B to catch likely problems. Large technology companies are running such validation checks automatically and continuously for their online experiments.