A/B testing and the historic lift paradox [redacted]
Marton Trencseni - Sun 25 July 2021 - redacted
This post has received very useful comments on Hacker News. Multiple commenters pointed to CUPED (by Deng, Xu, Kohavi, Walker), a method to compute an adjusted evaluation metric using historic "before" data. If "before" and "after" are correlated, which is often the case, this adjusted metric has lower variance than the original metric. In practical A/B testing terms, this means that if we apply CUPED we will on average see lower p-values, which is desirable. So the explanation in the post below, which was that "before" should never be used, is not correct! I redacted the misleading explanation to avoid confusing readers. Read this follow-up post about CUPED, which shows how to use correlations in historic data to reduce variance.
Introduction
Recently I encountered a new paradox in A/B testing. It goes something like this:
- Randomly split the set of people into treatment and control and apply the treatment to the treatment group.
- Measure the target metric M (eg. \$ sales per person) for control and treatment for T days: $ \alpha_C $ and $ \alpha_T $.
- Using historic data, for the same groups, measure metric M for the T days preceeding the application of the treatment: $ \beta_C $ and $ \beta_T $.
- Compute the "control lift" and "target lift": $ L_C = \frac{\alpha_C}{\beta_C} - 1 $ and $ L_T = \frac{\alpha_T}{\beta_T} - 1 $
- The "effect lift" is then $ L = L_T - L_C $
Let's put in some example numbers: We send some marketing materials to the treatment group, with the intention of increasing their spend. Measuring on a period of 28 days, the average spend in the treatment group is \$110 per person. For the same period, it's \$105 per person in the control group. Looking at historic data, we see that in the 28 days preceeding the experiment, the spends are \$101 per person and \$100 per person for treatment and control. So the "control lift" is \$105 / \$100 - 1 = 5% and the "treatment lift" is \$110 / \$101 - 1 = 8.9%, and the "effect lift" is 8.9% - 5% = 3.9%.
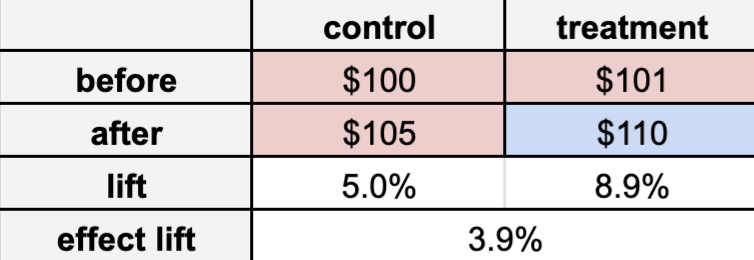
Note: red means no treatment, blue means treatment applied.
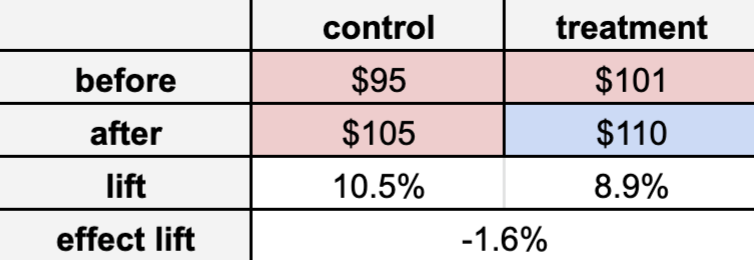
What's the problem here? The simplest way to show that the logic above is wrong is to play around with the numbers a little bit. Let's change just one number, the top left number, from \$100 to \$95. This changes percentages like:
So now the "effect lift" is -1.6%, which means treatment didn't work. Right? But wait! If we look at the second row, we see that during the experiment, treatment spent \$110 per person and control spent \$105 per person, so the "experimental lift", equal to $ \frac{\alpha_T}{\alpha_C} -1 $, is 4.7%. It's a paradox! Is treatment better or is control better? What's going on?
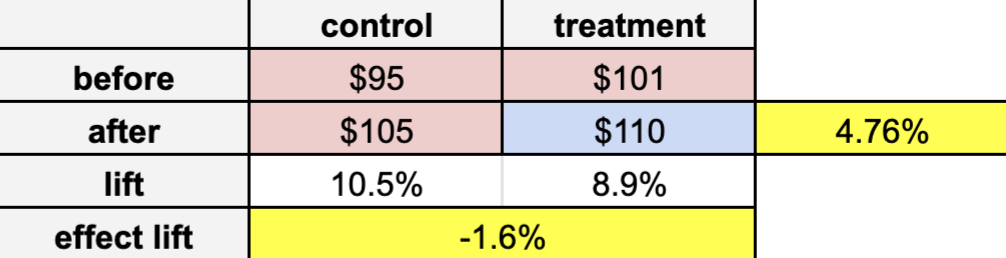
Note that this is not just a technical nuance. If we accept -1.6%, we say treatment is worse than control, and stop it going forward. If we accept 4.7%, we say treatment is better than control, the exact opposite. So the real-life business outcomes are very different!