Timeseries forecasting with Prophet
Marton Trencseni - Sun 18 July 2021 - modeling
Introduction
Prophet, formely FBProphet, is a best-of-class timeseries forecasting library from Facebook. It is open source, released by Facebook's Core Data Science Team. At Majid Al Futtaim we use it on a regular basis. It is a "one-shot" forecasting solution, because it gives close to optimal forecasts with default arguments, without extensive parameter tweaking or feature engineering.
Here I will show how to use Prophet without going into too much detail about its architecture. For that, check out the extensive documentation and other resources:
- Official Prophet documentation
- Getting started guide on TowardsDataScience
- Another guide on TowardsDataScience
The Jupyter notebook for this post is up on Github.
Getting started
Getting started with Prophet is easy. Let's use a sample timeseries dataset which contains hourly energy usage data for the major US energy company American Electric Power (AEP), in megawatts. We expect this timeseries to have daily and weekly seasonality, so it's an ideal candidate for forecasting:
# download data
df = pd.read_csv('https://github.com/khsieh18/Time-Series/raw/master/AEP_hourly.csv')
# rename columns, Prophet expects ds and y
df.columns = ['ds', 'y']
df['ds'] = df['ds'].astype('datetime64[ns]')
# keep training data
training_days = 2*365
forecast_days = 30
df = df.sort_values(['ds']).head((training_days + forecast_days) * 24)
df.index = np.arange(0, len(df))
# wipe target variable y for to-be-forecasted section
for i, row in df.iterrows():
    if i >= training_days * 24:
        df.at[i, 'y'] = None
df_train = df.dropna()
# train model
model = Prophet(yearly_seasonality=True)
model.fit(df_train)
# forecast
df_predict = df[['ds']]
df_predict = model.predict(df_predict)[['ds', 'yhat', 'yhat_lower', 'yhat_upper']]
fig = model.plot(df_predict)
Prophet also allows us to visually examine the forecast:
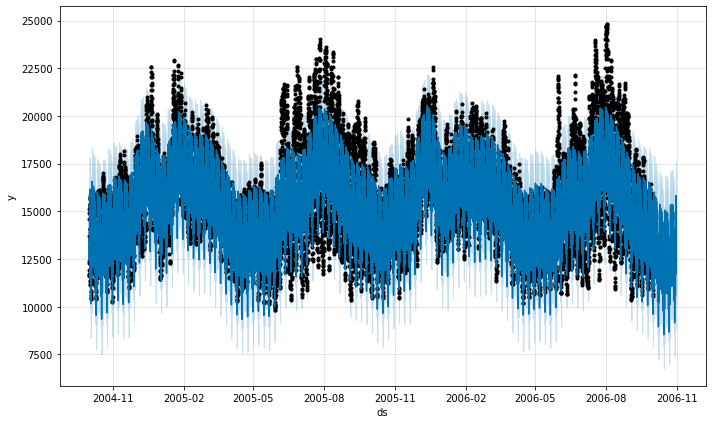
In my experience, if a "default" run of Prophet, like above, has some Mean Absolute Percentage Error (MAPE), then if we invest 1-2 weeks of custom modeling, we can find improvements of 2-3%, maybe 5% if we're lucky, but not more. So, Prophet yields very good forecasts out of the box.
Speaking about MAPE, let's adjust the code above to compare the forecast to actuals and compute the MAPE explicitly. Training on 2 years worth of data and forecasting 30 days:
# download data
df = pd.read_csv('https://github.com/khsieh18/Time-Series/raw/master/AEP_hourly.csv')
# rename columns, Prophet expects ds and y
df.columns = ['ds', 'y']
df['ds'] = df['ds'].astype('datetime64[ns]')
# keep training data
training_days = 2*365
forecast_days = 30
df = df.sort_values(['ds']).head((training_days + forecast_days) * 24)
df.index = np.arange(0, len(df))
# save ground truth
df['gt'] = df['y']
# wipe target variable y for to-be-forecasted section
for i, row in df.iterrows():
    if i >= training_days * 24:
        df.at[i, 'y'] = None
df_train = df.dropna()
# train model
model = Prophet(yearly_seasonality=True)
model.fit(df_train)
# forecast
df_predict = df[['ds']]
df_predict = model.predict(df_predict)[['ds', 'yhat', 'yhat_lower', 'yhat_upper']]
fig = model.plot(df_predict)
# join train and predict
df_cross = df.tail(forecast_days*24).merge(right=df_predict, on='ds', suffixes=['', '_predict'])
df_cross = df_cross[['ds', 'gt', 'yhat']]
mape = mean([2 * abs((row['gt'] - row['yhat']) / (row['gt'] + row['yhat']))
             for _, row in df_cross.iterrows()])
print('MAPE = %.3f' % mape)
Yields a MAPE=0.12 or 12%, which is pretty typical for real-life multi-day forecasts.
Holidays and periodicity
Internally, Prophet models the timeseries as:
$ y(t)= g(t) + s(t) + h(t) + ε(t) $
where:
- $ g(t) $: growth, piecewise linear or logistic
- $ s(t) $: periodic changes (e.g. daily, weekly, yearly seasonality)
- $ h(t) $: holiday effects
- $ ε(t) $: error term
Adding holidays is as simple as:
model.add_country_holidays(country_name='AE') # for UAE holidays
Regarding the $ h(t) $ term, most countries' holidays are correctly included out of the box, or you can add your own custom holidays.
Let's test how the periodic modeling term $ s(t) $ performs. As written above, out of the box Prophet assumes daily, weekly and yearly periodicity. Let's construct a sine wave time series which is perfectly periodic every 24 hours and fit Prophet:
forecast_days = 7
df = pd.DataFrame({'ds': pd.date_range('2020-01-01', '2020-01-31', freq='1H', closed='left')})
df['y'] = 2.0
spectrum = [1]
def f(i, row, period_day=1):
c = 2 * pi / (period_day * 24)
return sin(c * i)
for i, row in df.iterrows():
gt = row['y'] + sum([f(i, row, period) for period in spectrum])
if i < len(df) - forecast_days * 24:
y = gt
else:
y = None
df.at[i, 'y'] = y
df.at[i, 'gt'] = gt
df_train = df.dropna()
model = Prophet()
model.fit(df_train)
df_predict = df[['ds']]
df_predict = model.predict(df_predict)[['ds', 'yhat', 'yhat_lower', 'yhat_upper']]
df_cross = df.tail(forecast_days*24).merge(right=df_predict, on='ds', suffixes=['', '_predict'])
df_cross = df_cross[['ds', 'gt', 'yhat']]
mape = mean([2 * abs((row['gt'] - row['yhat']) / (row['gt'] + row['yhat']))
for _, row in df_cross.iterrows()])
print('MAPE = %.3f' % mape)
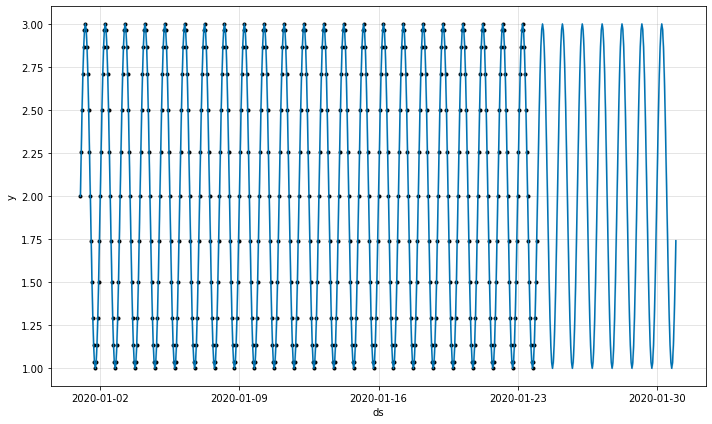
fig = model.plot(df_predict)
The resulting MAPE is 0, which means it's a perfect fit:
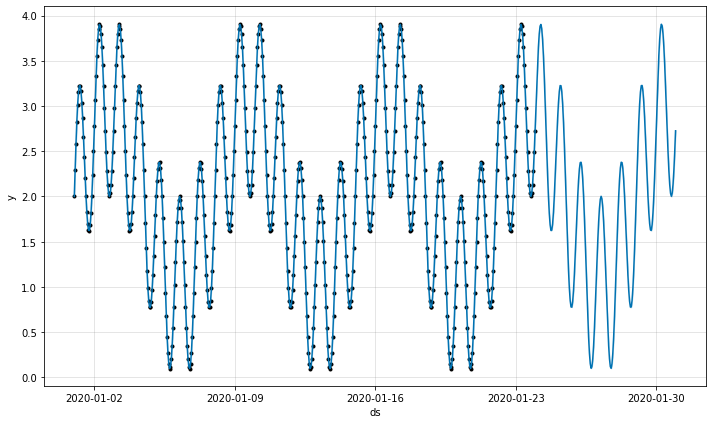
By changing the spectrum of the function, we can superimpose several sine waves. For example, we can combine a 1-day periodic wave and a 7-day periodic wave by changing one line in the above code:
spectrum = [1, 7]
This now looks more funky, but it's still modeled with MAPE=0 by Prophet:
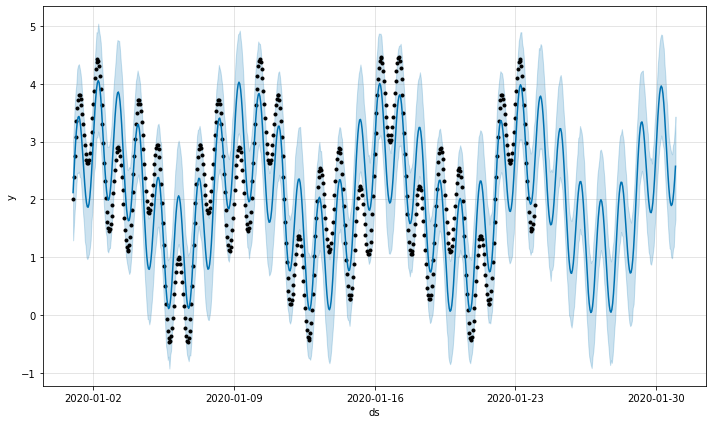
However, Prophet does not assume other periodicities. So if we add something else to the spectrum, the model's fit will no longer be perfect:
spectrum = [1, 3, 7]
This yields MAPE=0.962, which means it's way off.
However, we can tell Prophet that we suspect our data some specific periodicity:
model.add_seasonality(name='monthly', period=3, fourier_order=3)
After inserting this line, MAPE becomes 0 again.
Random noise
To test the error term $ ε(t) $ let's add some random noise of amplitude 20% compared to the original signal of the training data:
sigma = 0.2
for i, row in df_train.iterrows():
    gt = row['y'] + sum([f(i, row, period) for period in spectrum])
    if i < len(df_train) - forecast_days * 24:
        y = gt + gauss(mu=0, sigma=sigma)
    else:
        y = None
    df_train.at[i, 'y'] = y
    df_train.at[i, 'gt'] = gt
Since Prophet explicitly models the error term, the MAPE is only 1-3% depending on the amount of training data.
Missing data
Prophet handles missing data out of the box. As a user, we don't have to write any interpolation logic. Let's continue with the sine wave toy problem, but drop 20% of the rows:
drop_ratio = 0.2
drop_inds = [i for i in range(len(df)) if random() < drop_ratio and i < len(df) - forecast_days * 24]
df = df.drop(df.index[drop_inds])
The MAPE remains 0! What's interesting is, even if I drop 90% of the rows, the MAPE is still 0. This is because the model only needs 3 points to find the daily sine wave, which is what it's assuming internally.
Other features
Other useful features of Prophet, not explored further in this post, include:
- External regressors: tell Prophet that a portion of the history had some external effect (such as Covid-19) that it can regress on.
- Floors and ceilings: Prophet is domain agnostic, so it doesn't know about natural or reasonable limits. For example, if the tail end of the historic data is sloping downwards, Prophet may pick up on that and create a decreasing timeseries that goes to $ - \infty $, even though that may not make sense, eg. the megawatt usage per hour cannot be less than 0. By setting floors and ceilings, we inform Prophet of these "natural" bounds.
- Changepoints: Sometimes there is a distinct changepoint in the timeseries. For example, a SaaS company's daily active user (DAU) data may be flat until viral growth kicks in.
Conclusion
Prophet is a highly useful, one-shot timeseries forecasting tool which comes with defaults tuned to real-life product and business use-cases, such as daily, weekly and yearly seasonality and built-in holidays. Prophet is highly recommended for everyday production use.
If you are interested in timeseries forecasting, also check out NeuralProphet, which is inspired by Prophet but uses Pytorch and deep learning (not from Facebook), and Kats (also from Facebook), which provides a one-stop shop for time series analysis, including detection, forecasting, feature extraction and multivariate analysis.