Multi-armed bandits and false positives
Marton Trencseni - Fri 21 August 2020 - Data
Introduction
In the previous blog post A/B testing and Multi-armed bandits I compared fixed-split A/B testing, Epsilon-greedy, UCB1 and Thompson sampling. We saw that MABs offer an interesting alternative to fixed-split A/B testing, being in a different region of the exploration-exploitation space. We saw that with MABs, the price we pay for less regret at the end of the experiment is less statistical significance: in a balanced 50-50 fixed-split A/B test, A and B get an equal number of hits, irrespective of how they have performed so far, while MABs will favor the variant that has performed better. However, because of the imbalance, the final result will be less decisive (higher p-value), so we will be less sure that we actually found the better funnel.
In this post, I will explore what happens if A and B are actually the same; so neither A and B are really better than the other. In such cases, we ideally want the A/B test to not "go off" and call a winner (a false positive). In frequentist hypothesis testing, we control this with the $\alpha=p_{crit}$ parameter, which we set to 0.05 here. As a reminder of statistical hypothesis testing, see the earlier post A/B testing and the Z-test.
Metrics
I will use Monte Carlo simulations to compare the above 4 methods, with both A and B converting at 5%. I am curious about two outcome metrics:
- Imbalance: even though A and B are the same, MABs will probably favor one of the other, and for example A will get 80% of the hits and B only 20%; on average, how far off is this ratio from 50%-50%? Since there is no difference, a high ratio is not actually a problem, it's a measure of how much the MABs "mislead" themselves.
- False positive rate: how often is the result stat.sign?
Code
The Monte Carlo code, which computes the above metrics:
def choice(ps):
    return np.random.choice(len(ps), p=ps)

def simulate_abtest_many(funnels, N, num_simulations, simulate_abtest_one, p_crit = 0.05):
    ps = []
    num_winning = 0
    num_significant = 0
    imbalances = []
    for i in range(num_simulations):
        print('Doing simulation run %d...' % i, end='\r')
        observations, funnels_chosen = simulate_abtest_one(funnels, N)
        imbalance = abs(sum(funnels_chosen)/N - 0.5)
        imbalances.append(imbalance)
        p = fisher_exact(observations)[1]
        ps.append(p)
        if p < 0.05:
            num_significant += 1
    print('\nDone!')
    print('Avg imbalance: %.3f' % np.mean(imbalances))
    print('False positive rate: %.3f' % (num_significant/num_simulations))
    print('Histogram of p values:')
    plt.figure(figsize=(10, 5))
    ax = sns.distplot(ps, kde=False, rug=True)
    ax.set(xlabel='p value', ylabel='count')
    plt.show()
The code for the methods is unchanged, so I won't repeat it. I will simulate funnels converting at 5%, with N=10,000 samples, and run the experiments 1,000 times to get statistics. The driver code (for the fixed case):
funnels = [
    [[0.95, 0.05], 0.50], # the first vector is the actual outcomes, the second is the traffic split
    [[0.95, 0.05], 0.50],
]
N = 10*1000
num_simulations = 1000
simulate_abtest_many(funnels, N, num_simulations, simulate_abtest_fixed)
Results
First, the results from the last post, when B was better than A:
| method | N | num_simulations | conv_A | conv_B | ratio_better_won | ratio_won_statsign | ratio_traffic_better |
|---|---|---|---|---|---|---|---|
| Fixed-split | 10,000 | 1,000 | 5% | 6% | 1.00 | 0.59 | 0.50 |
| Epsilon-greedy(eps=0.1) | 10,000 | 1,000 | 5% | 6% | 0.85 | 0.38 | 0.70 |
| UCB1 | 10,000 | 1,000 | 5% | 6% | 0.99 | 0.61 | 0.58 |
| Thompson sampling | 10,000 | 1,000 | 5% | 6% | 0.96 | 0.40 | 0.80 |
The results for this post, when both A and B are the same:
| method | N | num_simulations | conversion | alpha | imbalance | fpr |
|---|---|---|---|---|---|---|
| Fixed-split | 10,000 | 1,000 | 0.05 | 0.05 | 0.004 | 0.035 |
| Epsilon-greedy(eps=0.1) | 10,000 | 1,000 | 0.05 | 0.05 | 0.368 | 0.039 |
| UCB1 | 10,000 | 1,000 | 0.05 | 0.05 | 0.029 | 0.054 |
| Thompson sampling | 10,000 | 1,000 | 0.05 | 0.05 | 0.234 | 0.090 |
Conclusion
My takeaways:
- UCB1 is not very appealing, since when B is better than A, it only puts marginally more traffic (
ratio_traffic_better) into B versus A when compared to fixed-split - Thompson sampling is the best for directing traffic to the better funnel (
ratio_traffic_better), but it has significantly higher false positive rate (fpr) - Epsilon-greedy looks like a good trade-off, and is simple to understand. If I had to use a MAB in production, I would conduct more tests with different epsilon parameters to see if there's a sweetspot.
Appendix
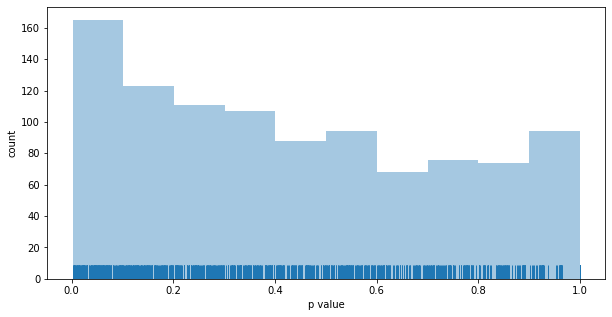
Distribution of p values for fixed-split testing:
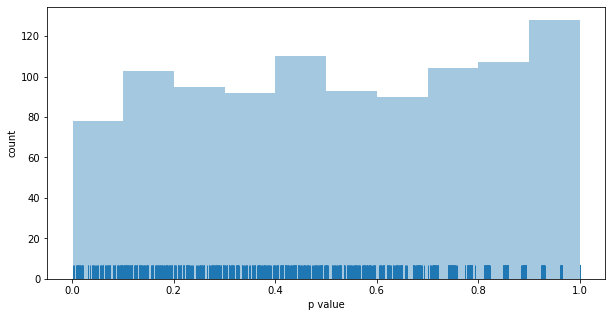
Distribution of p values for the epsilon-greedy MAB:
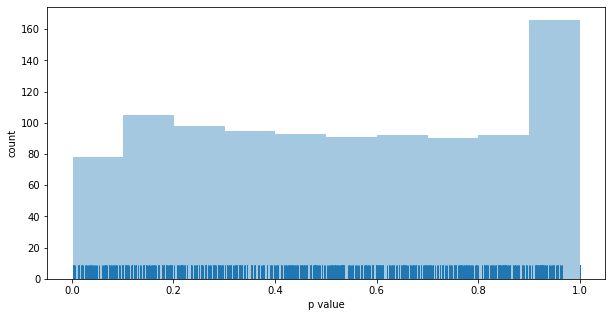
Distribution of p values for the UCB1 MAB:
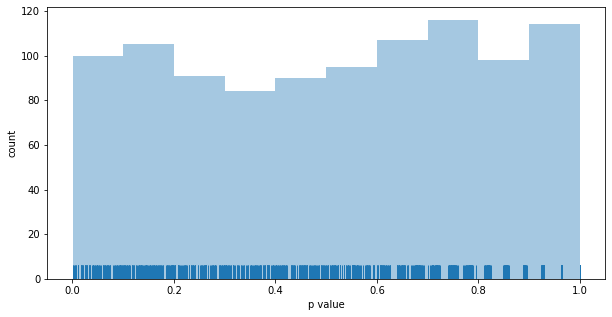
Distribution of p values for the Thompson MAB: