Growth Accounting and Backtraced Growth Accounting
Marton Trencseni - Sun 16 September 2018 - Data
Introduction
Previously I wrote two articles about data infra and data engineering at Fetchr. This time I want to move up the stack and talk about a simple piece of metrics engineering that proved to be very impactful: Growth Accounting and Backtraced Growth Accounting.
Standard Growth Accounting
Let’s start with Growth Accounting, a standard framework for understanding user lifecycles and churn in the SaaS world. I’ve implemented and ran Growth Accounting in previous jobs, but really grasped the importance (and how to do it properly) during my time at Facebook.
The basic framework of Growth Accounting is to assign a state to every object, every day. The possible states are:
- New
- Retained
- Churned
- Stale
- Resurrected
First, what is an ‘object’? An object can be anything, like a FB user, a FB group, a Prezi presentation or a Fetchr client company. The second part of Growth Accounting is determining which actions (or lack of them) lead to state transitions. For a user, actions are usually any activity, for a group is any activity in the group, for a Prezi it may be views. The third part of Growth Accounting is fixing the time horizon; this is usually either 1 day (Daily Growth Accounting), 7 days (Weekly) or 28 days (Monthly).
So, before Growth Accounting, we need to decide the:
- object
- actions
- time horizon
The most common use-case for Growth Accounting is users, on a monthly basis, so I’ll stick to that example in the first part:
- object = users
- actions = any activity by user
- time horizon = 28 days
Growth Accounting then says:
- a user is a Monthly Active User (MAU) if they had any activity in the last 28 days
- run the below state transitions daily to get the user’s Monthly Growth Accounting state:
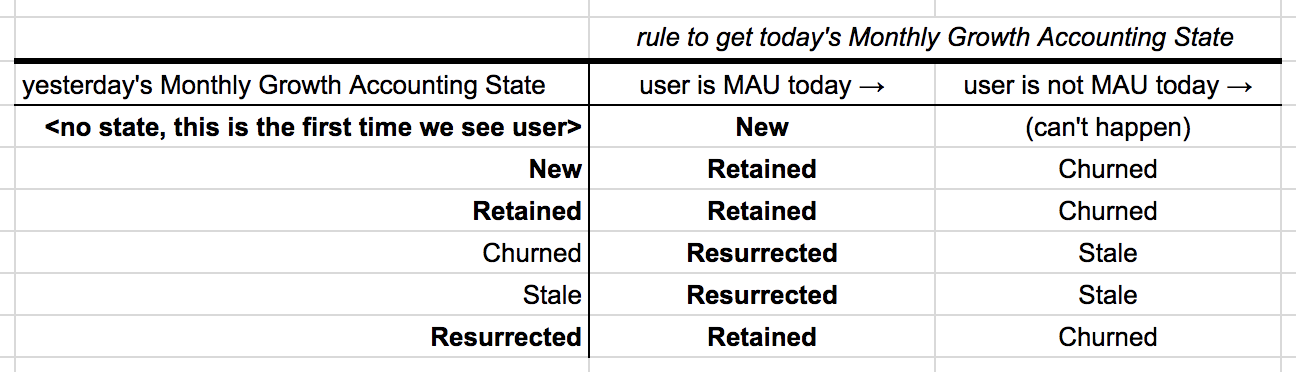
The same state transition table works for Daily Growth Accounting by replacing MAU with DAU (Daily Active User), and Weekly Growth Accounting by replacing MAU with WAU (Weekly Active User).
Some notes:
- users are in the New state for only one day (the first), irrespective of whether Growth Accounting is Daily/Weekly/Monthly
- users are in the Churned state for only one day, irrespective of whether Growth Accounting is Daily/Weekly/Monthly
- users are in the Resurrected state for only one day (the first active after a period of inactivity), irrespective of whether Growth Accounting is Daily/Weekly/Monthly
- inactive users end up in the Stale state (when speaking, we tend to say ‘churned users’, but stale is a more accurate term)
- continuosly active users end up in the Retained state
- the two states where users bulk up are Retained and Stale
The point of doing Growth Accounting is to count every day the number of New, Retained, etc. users (plus Net New, see below) and put the counts on a time series chart (perhaps a stacked one), and look at it every day. What this usually shows:
- every product churns out users, so Churned will be non-zero
- almost every product churns out a lot of users, so Stale will monotonically increase
- if Churn increases, that’s potentially bad, or the product is just growing
- if the product is healthy, Retained should increase
- The Growth Accounting equation is:
Net New = New + Resurrected - Churned
- if Net New > 0, that’s good, the MAU count (or DAU or WAU) is increasing
- if Net New < 0, that’s bad, the MAU count is decreasing, the product is slowly “dying”
Some comments about the Monthly, Weekly, Daily bit:
- When doing Monthly Growth Account, 1 day of activity is enough to make the user MAU for 28 subsequent days (first they will be New or Resurrected, then Retained for 27 days, then Churned for one day and then Stale, assuming they’re not active again):
New/Resurrected (1st day) → Retained (2..28) → Churned (29) → Stale (30th day) - When doing Daily Growth Accounting, 1 day of activity will make the user DAU for one day, the state transitions will be quick:
New/Resurrected (1st day) → Churned (2) → Stale (3rd day)
Usually it makes sense to run all three (D/M/W) and keep tabs on all of them. DAU and WAU respond quicker to problems (with MAU, if there’s a problem, people won’t enter Churned for 28 days after the last activity), but are also more volatile.
As discussed in the introduction Growth Accounting as a framework can be separated from the object and activity definition, and can be run for different time periods. So it makes sense to write it as a modular script that can be reused by plugging in whatever object/action definition. Thinking about tables, Growth Accounting needs as an input just 2 columns:
- day: a date
- id: the id of the object
A row like (day, id) simply means that object with id was active on that day. That’s it. Given this table, a starting date, and a choice of D/W/M, a Growth Accounting framework can generate the output:
- day
- id
- state: the growth accounting state of the object with id on day
We use Airflow, our Growth Accounting framework is baked into a function dag_growth_accounting(), and it’s parameterized like:
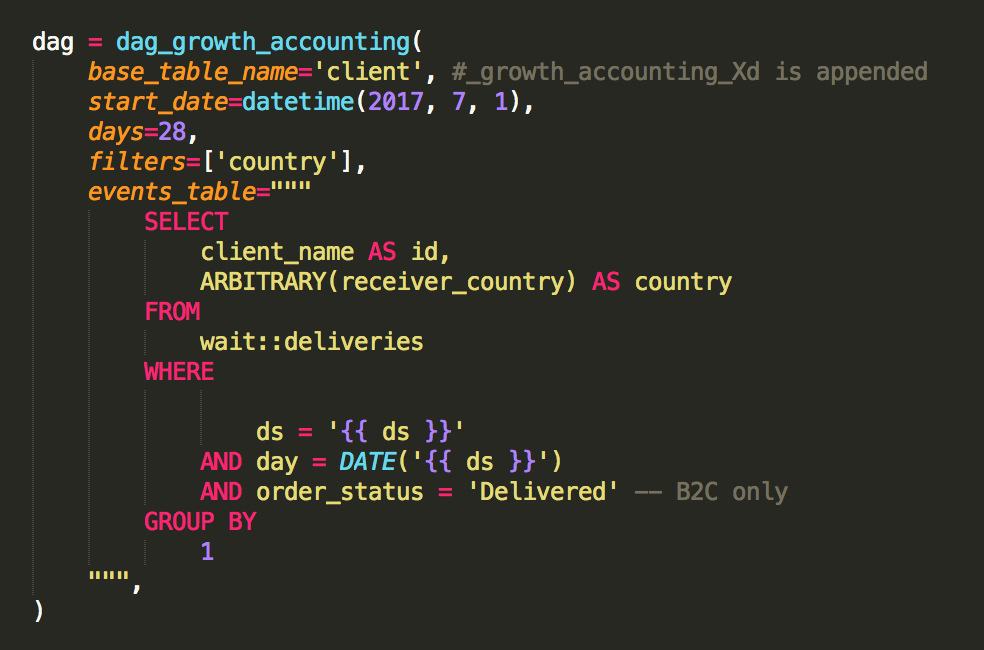
This is the definition of our B2C Client Growth Accounting pipeline. The resulting table is client_growth_accounting_28d, the first day for which states are generated is 2017-07-01 (on that day every object with activity is New), it’s Monthly Growth Accounting, and activity is when we make a delivery for a client. Day is not an explicit column here, the events_table is used as a sub-select in the script for every day when Growth Accounting runs.
There is one additional feature here, there is an additional country column. This makes it possible to filter the charts for country, so we can see per-country counts. This is just a property that is attached to the objects.
The code for the framework function dag_growth_accounting() which creates the Airflow DAG is below:
Note that this also calculates the L-number for each object: the number of active days in the last X days, where X is 1, 7, 28 depending on whether we're doing D/W/M Growth Accounting.
Backtraced Growth Accounting
The challenge we faced at Fetchr is that standard Growth Accounting treats every object the same. One user equals another user, one churned user equals another churned user, and so on. There is no concept of a “more valuable user”.
But when doing Growth Accounting for our B2C client companies, this is not true. If Client X gives us 5,000 deliveries per day, and Client Y gives us 10 deliveries per day, then if Client X churns, that’s a big deal, but Client Y is less important than Client X.
There are various ways to go about this. One possibility is to use the standard Growth Accounting count charts, but weigh each object by their “activity weight”. For example, in our case, we could weigh each client by the number of deliveries they gave us in the last 28 days. But then how do we weigh them once they churn and then become stale? In the end we did not go down this route.
We chose a relatively simple approach, which works well for us:
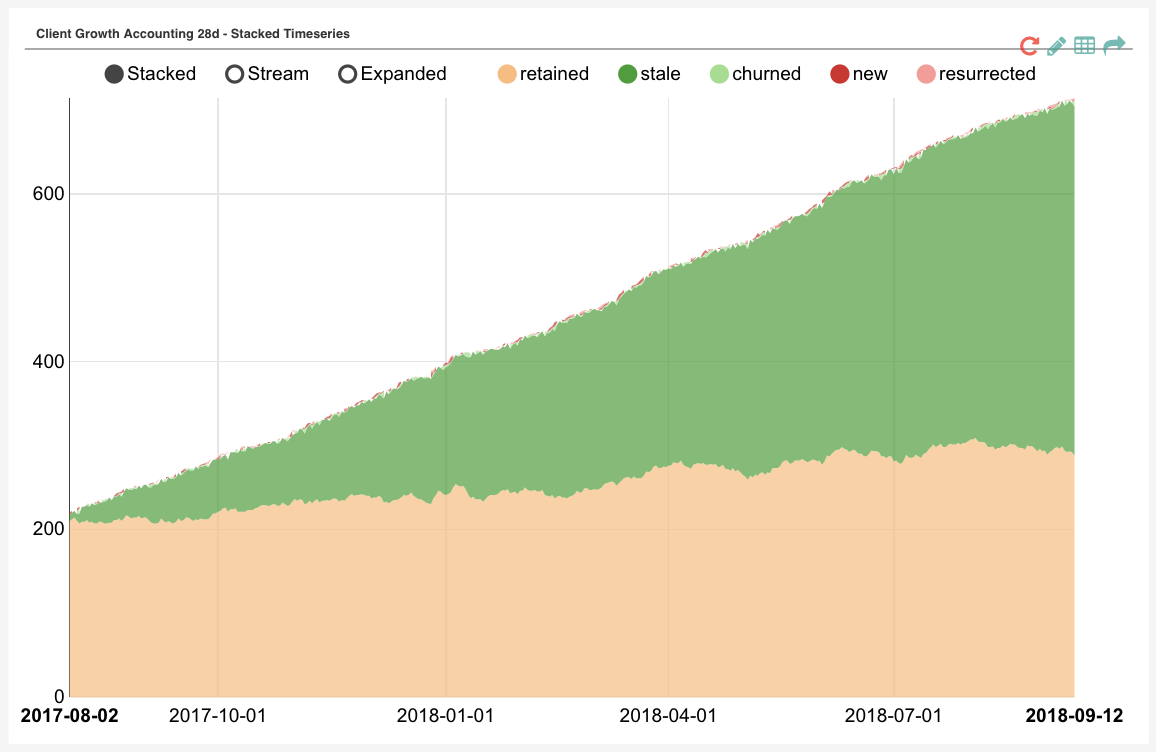
- Picture #1: Show Standard Growth Accounting charts to show how clients behave, with each client being weighted equally
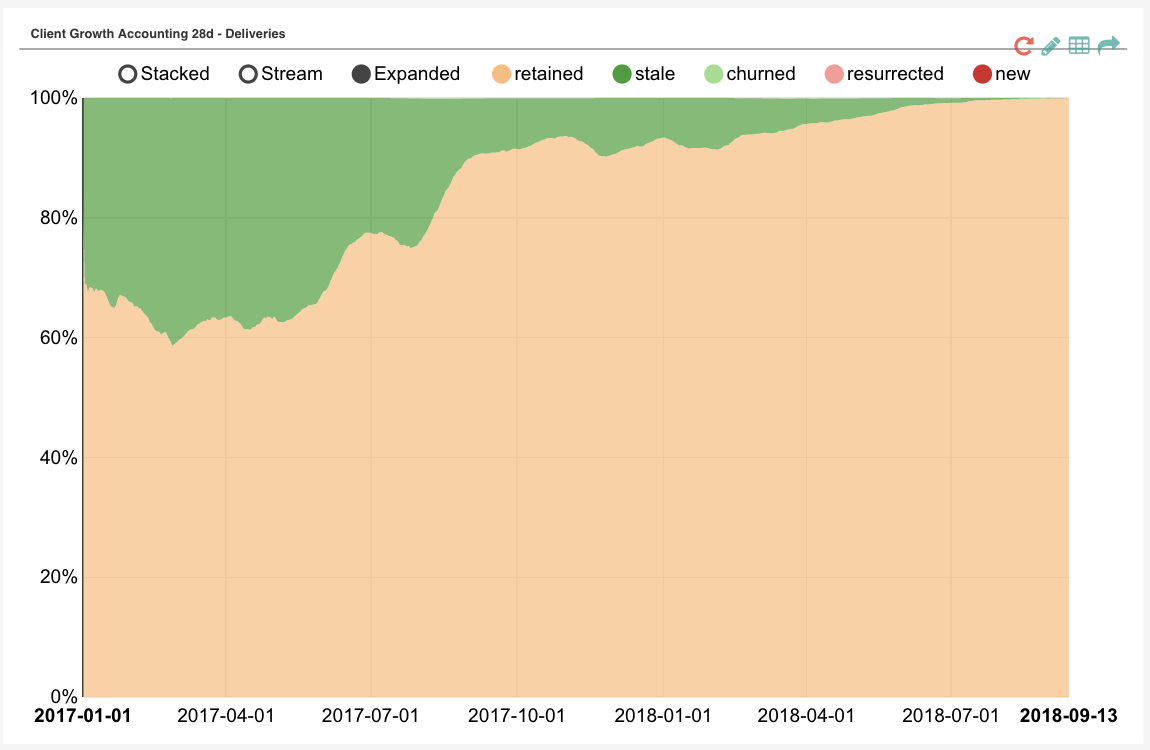
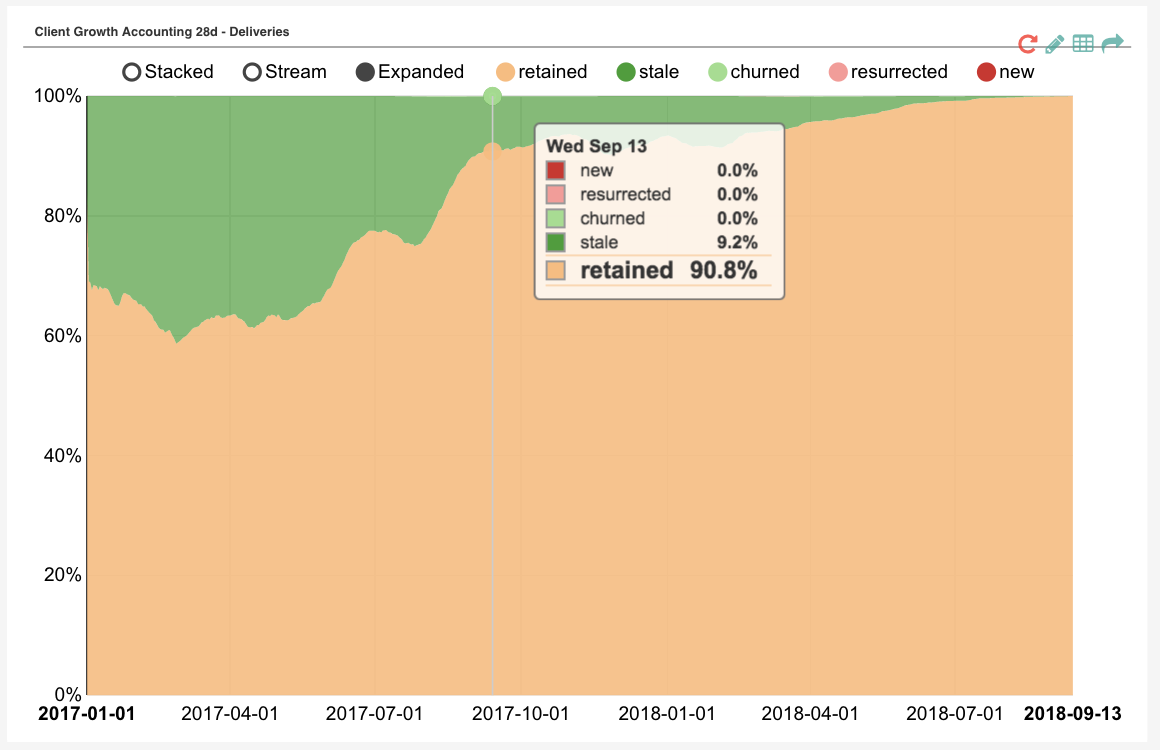
- Picture #2: Also show our historic B2C deliveries, with each delivery (from Client X) colored according to Client X’s current (today’s) Growth Accounting state, historically, all the way back. This “backtracing” is what gives the name of Backtraced Growth Accounting.
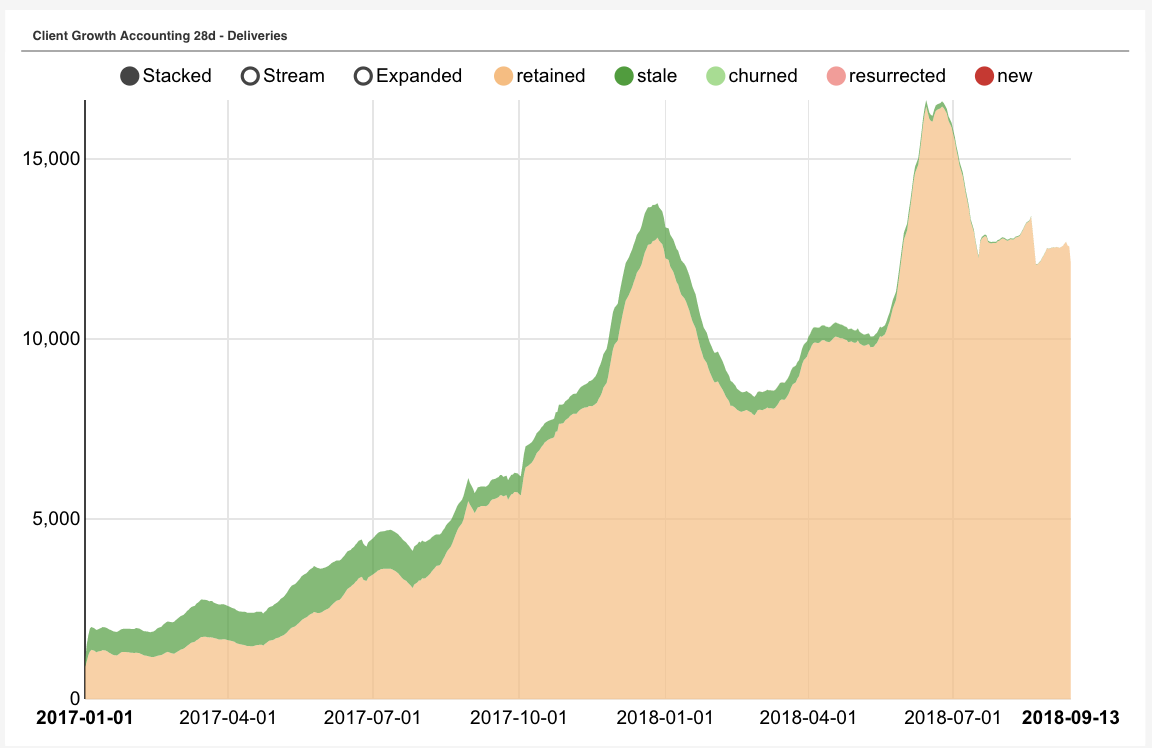
-
How to read the “scissor chart” above:
- Today, all deliveries are Retained ( if we made a delivery in the last 28 days for a client, that client is Monthly Active, so they will be Retained or Resurrected)
- As we go back in time, more and more deliveries are “colored” Stale, because they are for clients that don't use us anymore (no delivery in the last 28 days), so they are Stale
- Going back in time it's easy to read off what % of deliveries were for companies that have already churned out
- Whales churning/retaining is easy to read off: going backward in time, at the point where a whale churned there will be a jump in Stale deliveries (when they stopped using us)
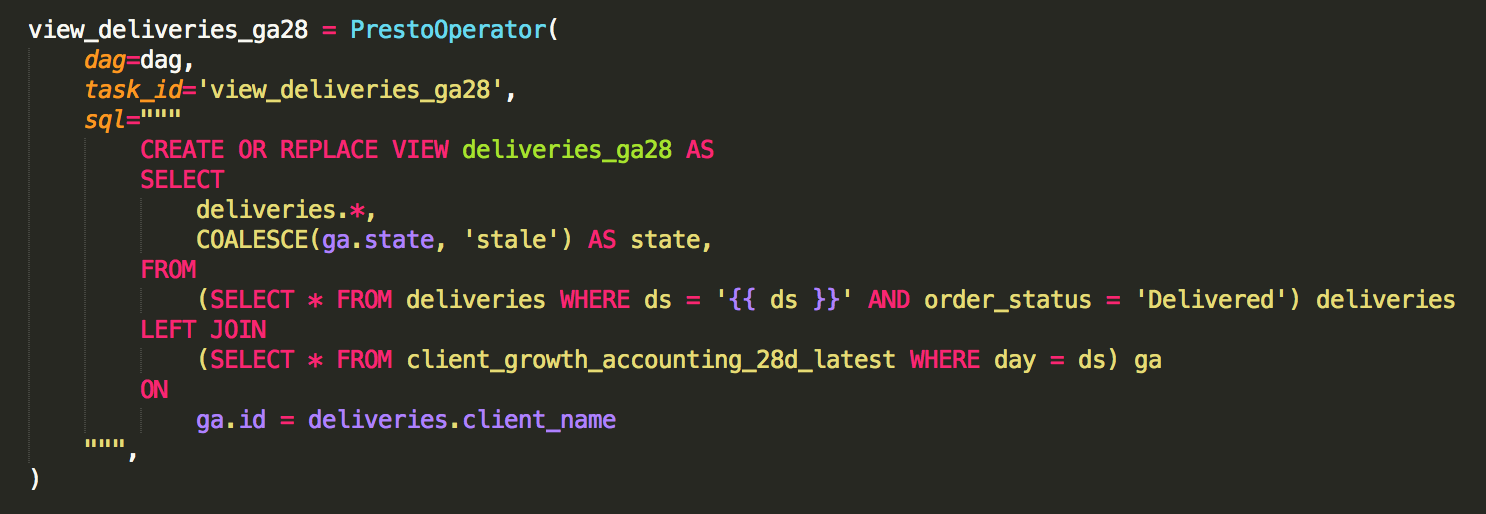
In terms of code, to perform the backtrace (the sciccor view) is trivial once we have Growth Accounting:
The big risk of this Picture #2 is that it hides onboarding problems: if a lot of clients come on, try us out by giving us low volume and then leave, it will not dramatically impact such a weighted view. That's not a problem though, that's why we also look Standard Growth Accounting (Picture #1).
Backtraced Growth Accounting like this also makes sense for more common SaaS use-cases:
- Color (state ↔ color) historic pageviews, message sends, document creates, time spent by the current GA state of the user
- Color views of a document by the current GA state of the document (eg. a Prezi)
- Color posts in a group by the current GA state of the group (eg. a FB group)
- Color deliveries made by a driver by whether the driver is still active with the company (eg. at Fetchr or Uber)
The Backtraced Growth Accounting picture has become a standard part of our thinking when it comes to client retention, but as the examples above show it can also be useful in other product and business settings. Implementing a framework is simple and fun, it can be deployed repeatedly (we run it for both B2C and C2C use-cases), it’s a relatively easy way to get insight and have top-level impact.
At Fetchr, implementing Growth Accounting and Backtraced Growth Accounting had a major impact on our B2C thinking. Before this, other teams ran one-off analysis with arbitrary cuts on (if client X gives us Y orders, but next month they give us 0.6 * Y, then...), which could be tuned to give any desired answer. Standardized Growth Accounting as described in this article gives a clear, parameter-free picture of both our client-wise and order-wise retention. For us, it showed the business is healthy and growing. The Growth Accouting charts today are on CxOs dashboards and are also presented to investors to explain our B2C business.