Beautiful A/B testing
Marton Trencseni - Sun 05 June 2016 - ab-testing
I gave this talk at the O’Reilly Strata Conference London in 2016 June.
Disclaimer: this is not about Facebook A/B testing. If you want to hear about that, you will be disappointed, because nothing here is about Facebook. This is based on my experiences at previous jobs.
5 years ago I was working on my own startup, it was called Scalien, a combination of the words Scale + Alien. It was a cool name, and we had a cool product called ScalienDB that nobody wanted, a NoSQL database that unlike other NoSQL databases used an algorithm called Paxos for consistent replication, whereas the competing products used Eventual Consistency. Scalien didn't work out and after we shut down the company I took a job with Prezi in Budapest, Hungary, where I'm from. I was hired at Prezi as a data engineer, and eventually became the head data guy. My job was to build out the data team and the data infrastructure, and one of the projects I worked on was A/B testing, figuring out how the company should do A/B testing.
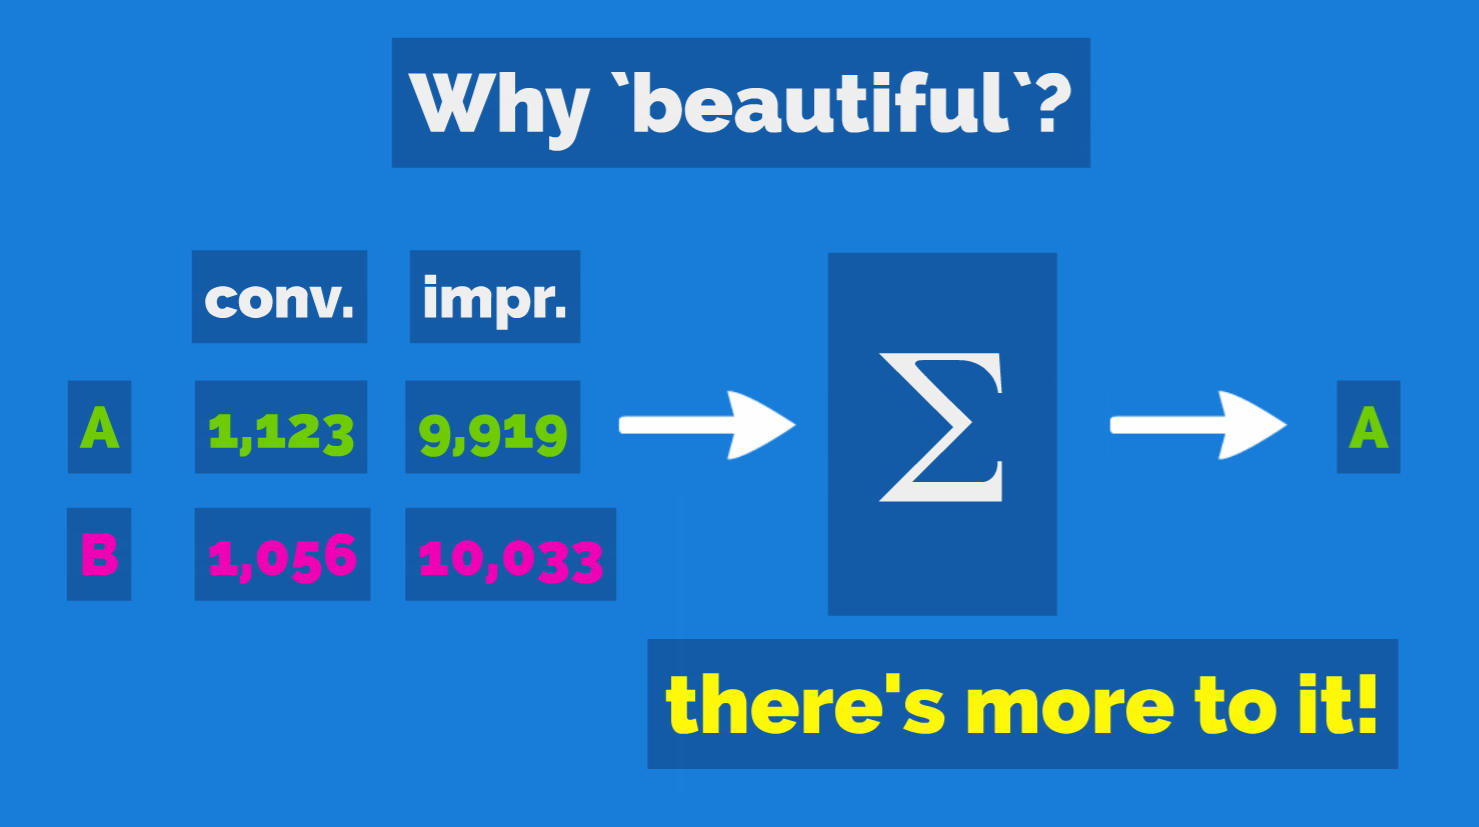
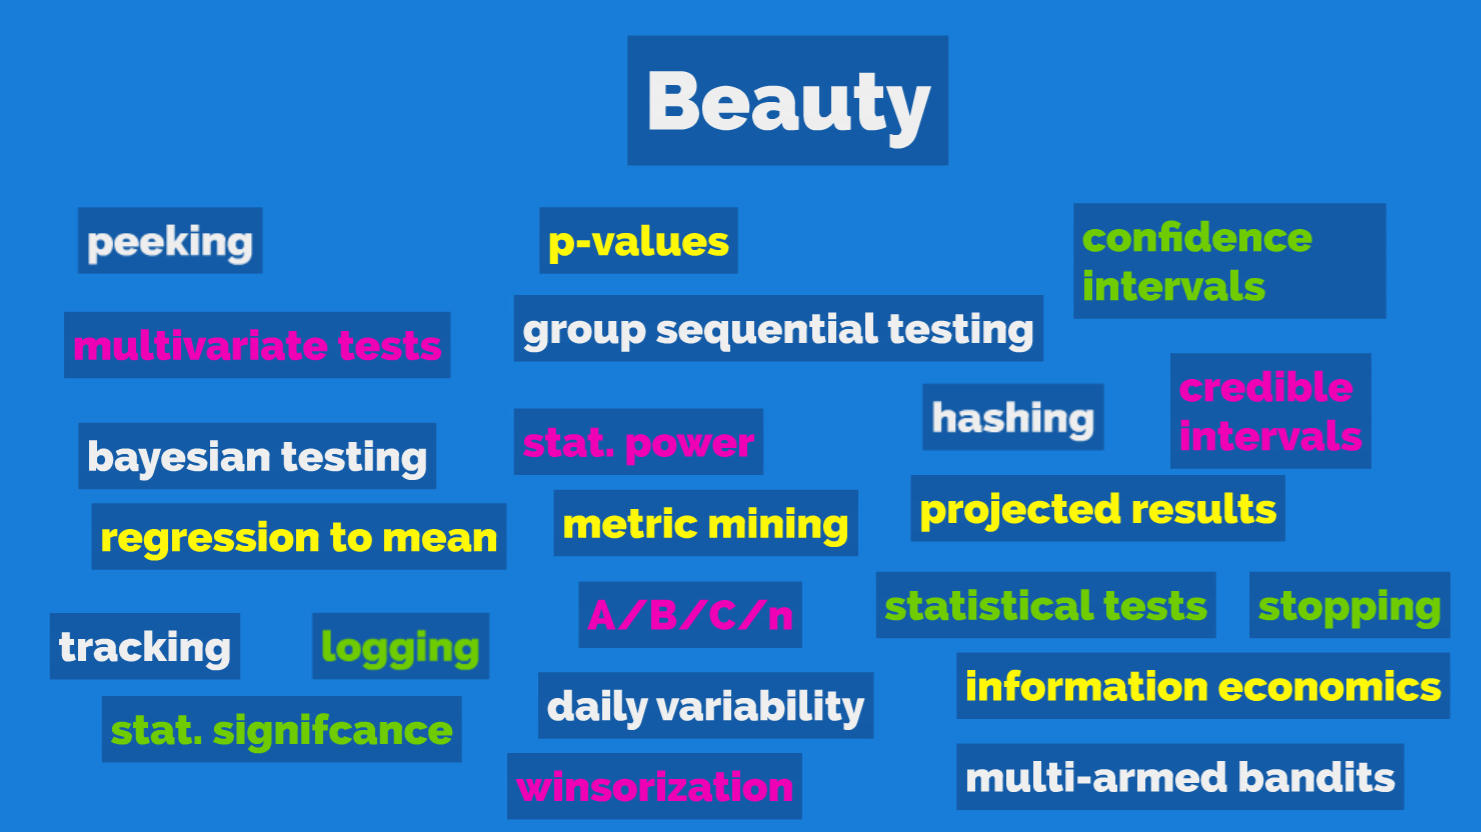
When I first started to think about how to improve the A/B testing culture and saw the problems we were having, I was a bit surprised. I thought, isn't it as simple as taking four numbers (the total impressions for A and B, and conversions for A and B), plugging it into some math equations, and reading off the results? I guess the naivete I had back then is a testament to the fact that even an education in Physics, the cradle of the scientific method, doesn't prepare you for how much more there is to it (=the scientific method), and sort of explains why so many academic studies are flawed. So the title is beautiful because (other than stealing this trendy phrase from O'Reilly) it turns out that A/B testing is a much more complex topic, and the actual complexities that you find when you look into it I personally find beautiful.
I cannot claim I have found all pitfalls or know all the answers to the issues around A/B testing; here I will tell you what I learned in the last 3 years, what fallacies I found, and how we tried to work around them.
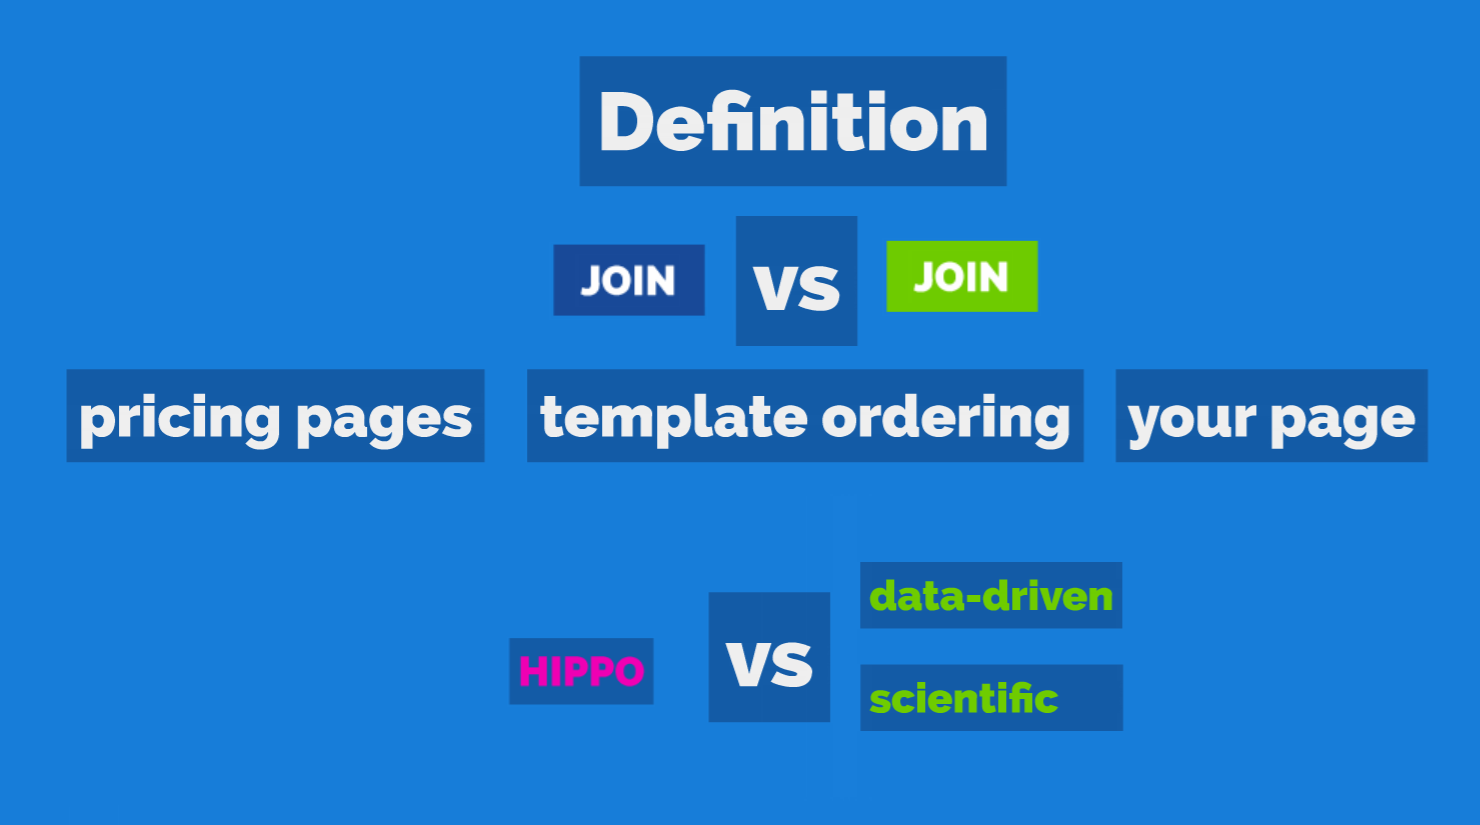
Let’s define what A/B testing is in this context here: you have two variants of your SaaS product, and you want to see which one is better. Note that you don't need to perform an A/B test (=compare two variants) if you just want to measure metrics for the new version! Performance is always measured relative to some relevant business metric, and on your target audience, the users you care about. The standard simple example is checking whether a button should be green or blue, which converts better. Another example is reorganizing templates that you can use in an editor, and seeing whether it affects user behaviour, like spending more time in the editor or creating more presentations. A third example is trying out different variants of a pricing page, and seeing how it influences people's choices between free and various paying options of a freemium product.
No talk about A/B testing is complete without mentioning HIPPOs. HIPPO stands for Highest Paid Person's Opinion, and is the antithesis of A/B testing and scientific thought: it's when the big guy decides what happens with the software based on her own personal preferences, and in general it's a bad idea.
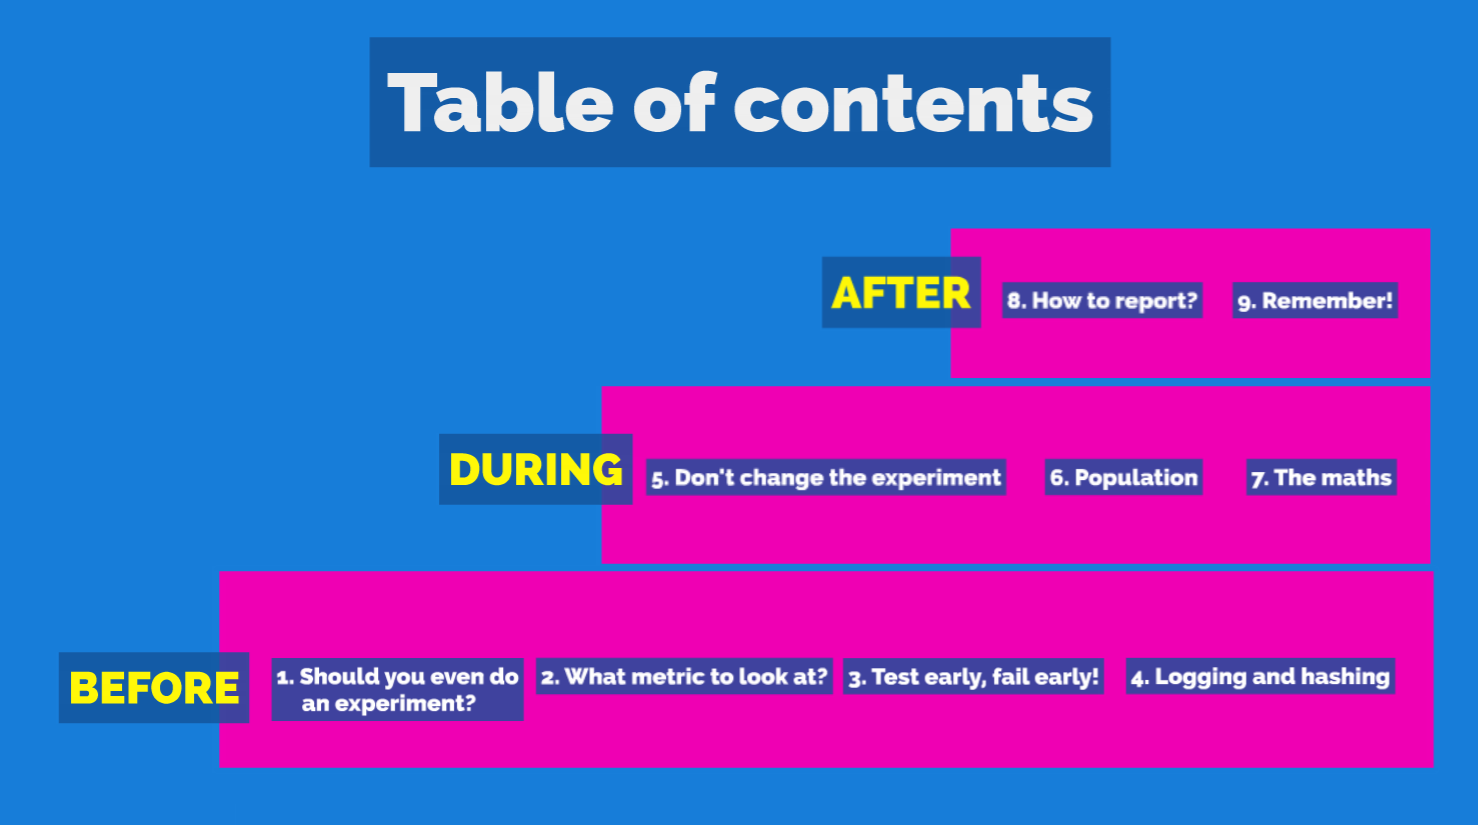
The talk is divided into 9 topics, organized in a nice staircase, as they are based on each other:
- 4 are things you should think about before doing an A/B test
- 3 are relevant while the test is running
- 2 are things you should do after the A/B test is finished
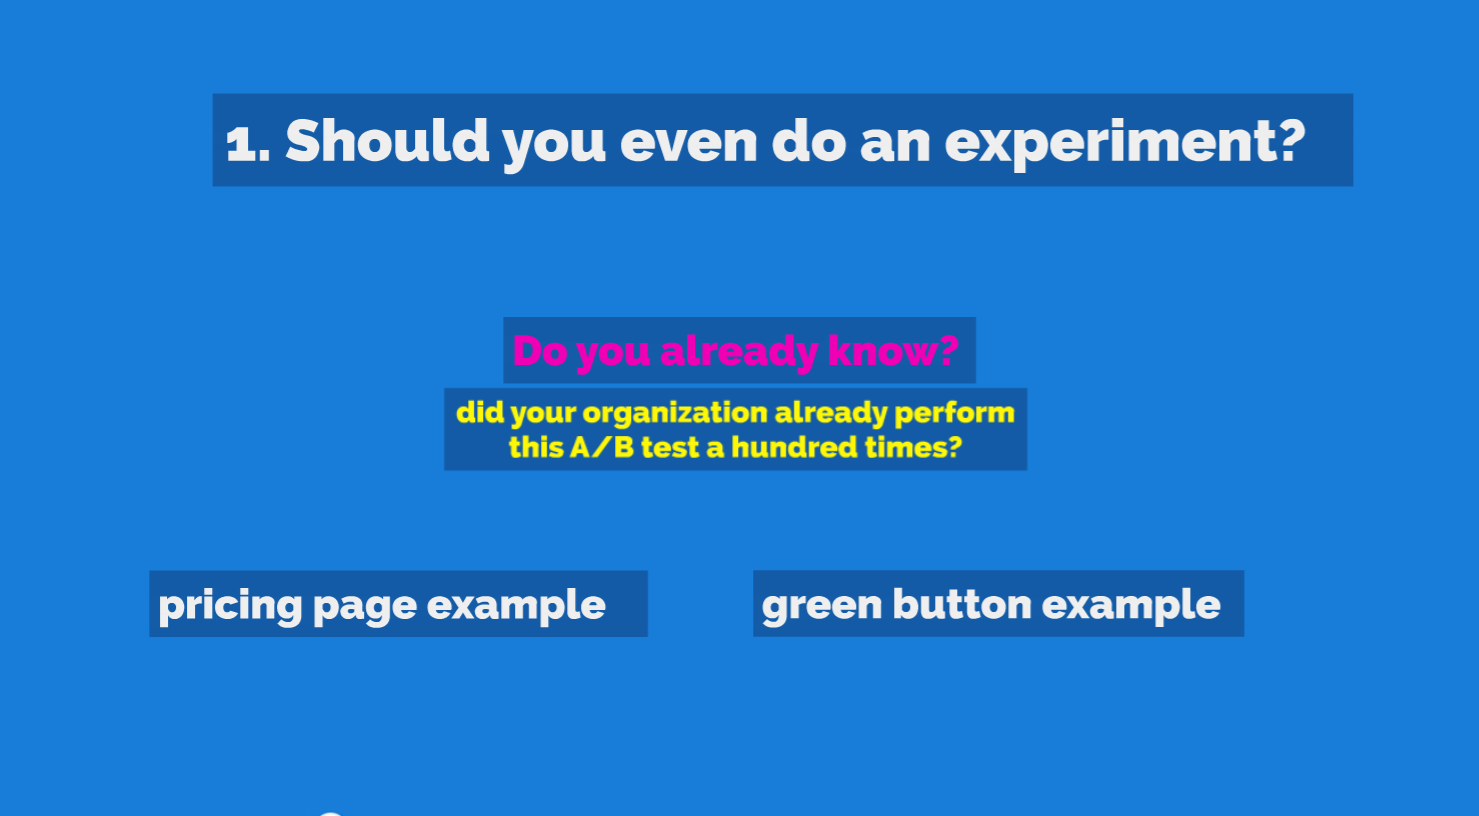
The first example is about pricing pages. In a freemium business, users can go free or choose one of the paying options to get extra features. One thing we learned is that, if and as we make the free option on the pricing page smaller and the color less distinguished, people chose the paying option more (paying after a free trial period). After a few such experiments, we didn’t need to do an A/B test just to learn this, we already knew.
The other example is about sign up emails. After a large number of such experiments, we learned that green buttons work better with our blue color scheme. (We also learned that designers are unhappy with green buttons.)
So the lesson is, don't run an A/B test---which is an experiment to tell whether A or B is better---when you already know from past experiments which one will be better. Note that not doing an experiment doesn’t mean you should not measure the metrics associated with a new version, that’s not the same thing.
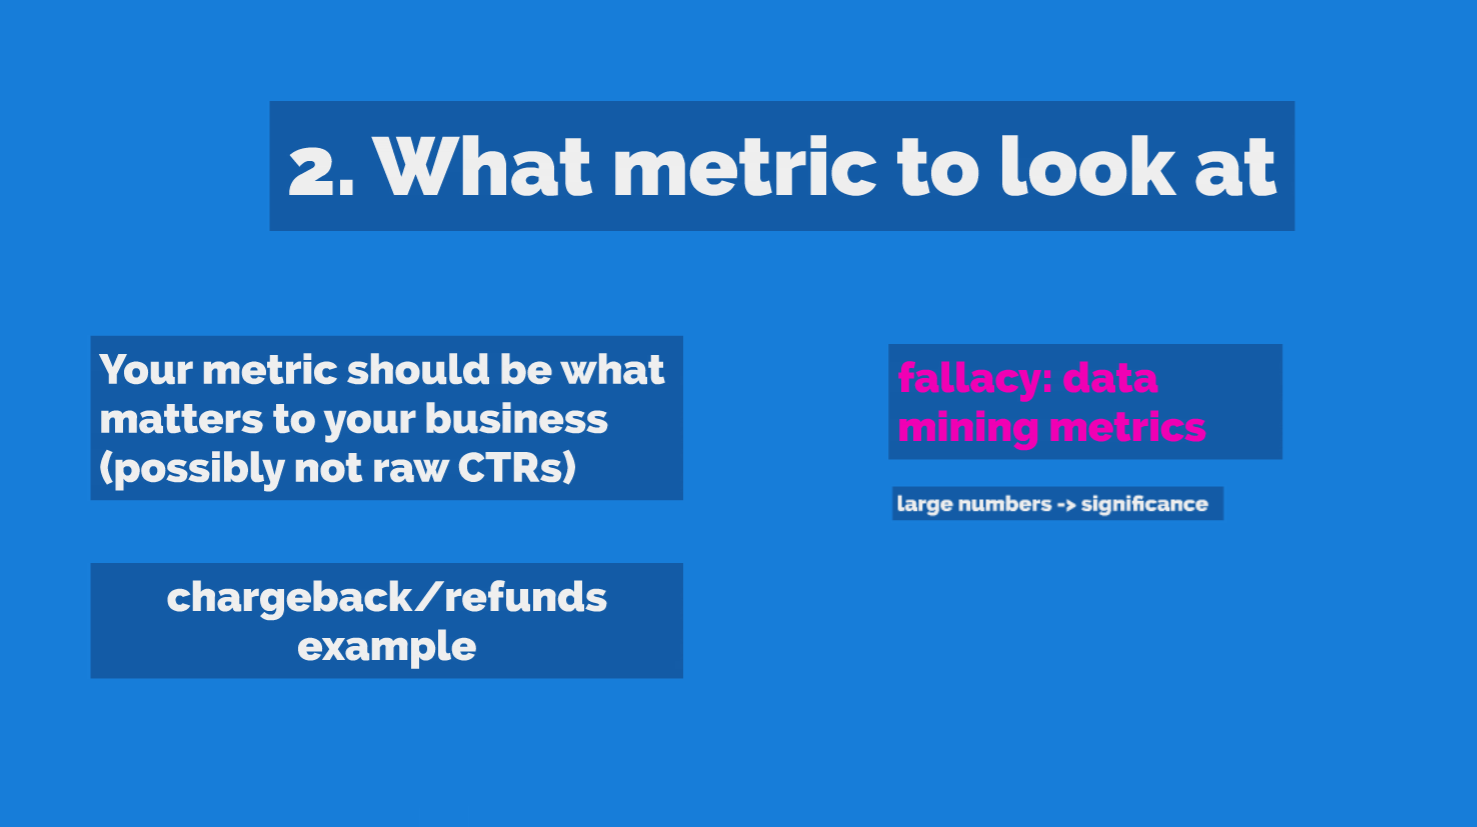
When you run an A/B test, you have to decide what metric to look at, and that should be the right metric. A mistake many people make is they focus on a more immediate metric like conversion. But usually your desired business outcome is 3 more steps down the line, so you should focus on that. Usually this metric you should look at is related to something important to your business, like revenue, or how many pieces of content people make, or how much time people spend viewing content, and so on; or to give an example from social networking: do people post more, comment more, do they spend more time with the product, and so on.
This is very tricky, and even when you think you're doing the right think, you may not. One story here is series of experiments that was performed on a pricing page. And we were smart, we didn't just look at clicks, we looked at the revenue generated. And we saw it was better, and we were super happy, we changed the HTML of the pricing page and now we're making more money! But we didn't have a good understanding of payment flows, so we didn't take into account refunds and chargebacks. A refund is when a customer asks you, the merchant for the money back. A chargeback is when the customer asks their credit card company for the money back. The way it works, if you're an online SaaS, essentially is a customer asks for money back, you want to give it back, to have good relations with customers and look good with the payment providers, because you're at their mercy. So these are 2 channels that we should have taken into account, and subtracted from the results of the A/B test. This is of course hard, because it requires sophisticated tracking and data collection, plus patience, because chargebacks are collected not by you, and only arrive at your doorstep 30-60 days after the payment event.
A fallacy related to the question of which metric to look at is what I call data mining metrics. I haven't yet talked much about technical concepts like statistical significance, and I won't because this is not intended to be a deeply technical talk. But most A/B tests are run using what's called frequentist statistics. With these statistics, after collecting samples for both A and B (exposures, conversions), you calculate something called the p-value. The p-value is usually expressed as a %, like 3%. The p-value has a very specific meaning, and it's the false positive rate. It says, if you were to repeat this experiment many-many times, given the current results, the math says that there is 3% chance of getting this outcome, assuming that A and B are the same. So the way frequentist A/B testing works is that, a company usually standardizes on a threshold like 5%, saying, let's run our A/B tests long enough so we collect enough samples so we only accept a false positives 1 out of 20 times. So the fallacy here is that if you have many business metrics, let's say 20, and you run a test, and then you calculate A vs B for all 20 metrics, and you find one metric where B is better than A (p is less than 5%), and you accept it; then, if this is your methodology, then in the long run you're wrong in thinking that your false positive rate is only 5%. It will be much higher, because you're essentially giving yourself extra chances, like is B better wrt to Metric 1? How about Metric 2? and so on. So you shouldn't fool yourself like this.
Of course you should look at a bunch of metrics after the A/B test, but:
- before the test, you should select the target metric, and put it down in your A/B testing tool to keep yourself honest
- when you look at other metrics later, just remember that you're increasing the chance of seeing a false positive
- if you find a lift in another metric that seems like a reasonable effect that you didn't think off, repeat the A/B test with that target metric
Large numbers => significance. There is one more thing to keep in mind. Large sites with a lot of traffic, they won't have these problems, because they can quickly collect so many samples that the p-value goes way down to like 1 in 10,000, and then you can look at many metric and still be reasonably sure that it's not a false positive. Essentially, if you collect a lot of samples, you're converting that bell curve estimate of the metrics, which has a certain precision error, into a point estimate as the bell curve becomes leaner and leaner, and you can compare those "freely". I'm a bit oversimplifying, but that's the gist of it.
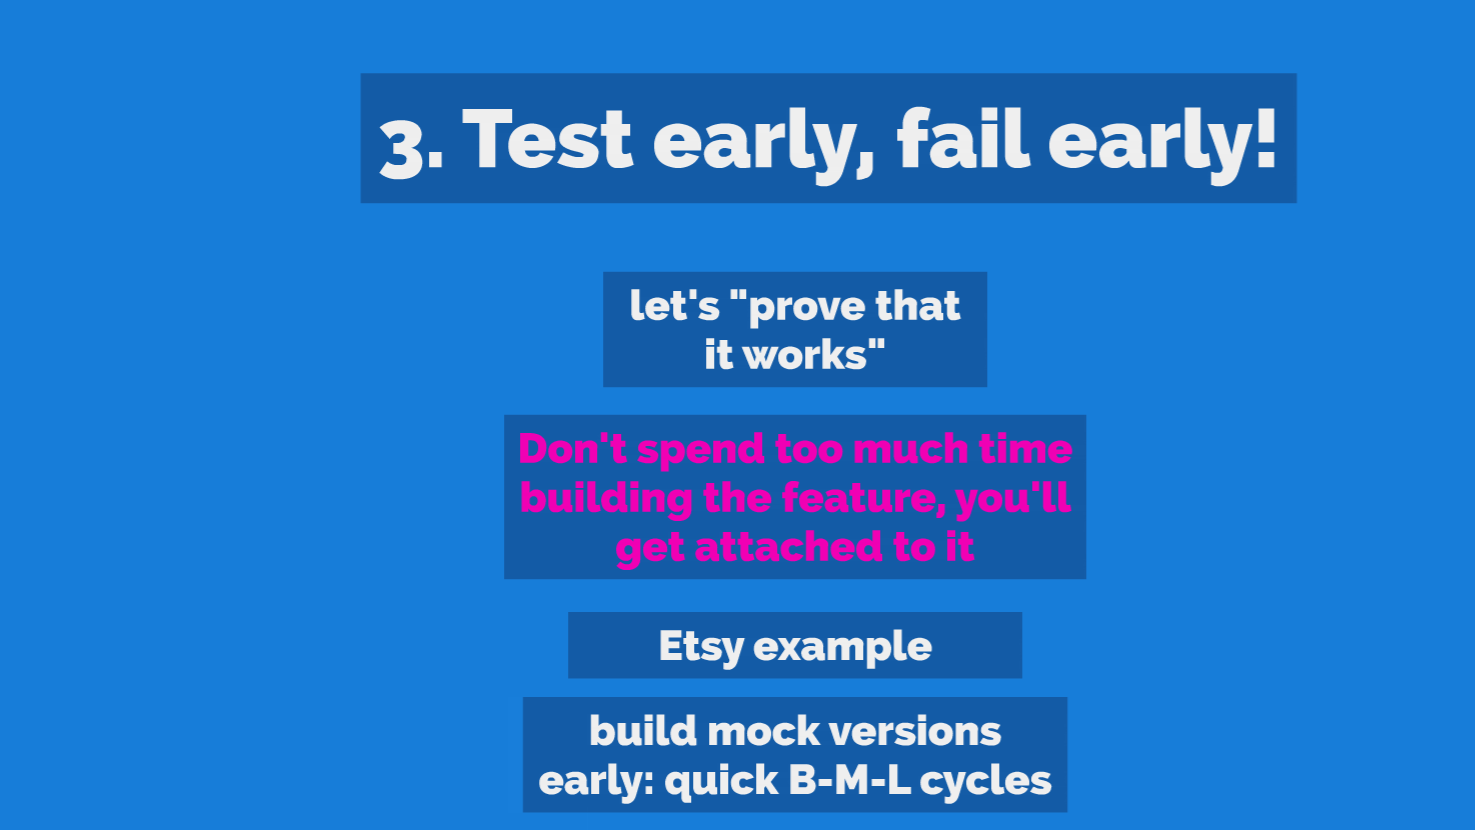
This is a simple lesson that I learned by observing PMs in action. The anti-pattern is that a product team will spend 2 months building out a cool new feature, and then they will run an A/B test on it "to prove that it works". Note how I said "to prove that it works". The problem is, after 2 months of invested time in the project, the team wants to see the thing succeed, they don't want their work to go to waste. This is when people can get really creative with p-values and explaining the results, if the results are negative or just inconclusive.
I will cite an example that I heard from a guy at Etsy some time back because it's a great example. They were developing infinite scroll, and they invested a lot of work, but the A/B test showed it's performing much worse then the original. It was hard to let go. In the end they performed a sort of back-test to verify the negative result, and they simply increased one parameter in the original version, instead of showing 40 items they showed 80. And surprisingly, that already showed that users don't like that, so they could have saved a lot of development time by performing that simple A/B test first.
In a SaaS environment, where you can release anytime and hopefully you have a lot of users, always try to test mock versions early. It's really the same idea as the Build-Measure-Learn loop from the Lean Startup book, it's just that people forget that the whole point of BML is that you want to get to a place where you're moving through BML loops very quickly. So I think if you spend more than 2 weeks on a feature before you start collecting data on it, you are in danger of getting attached to it.
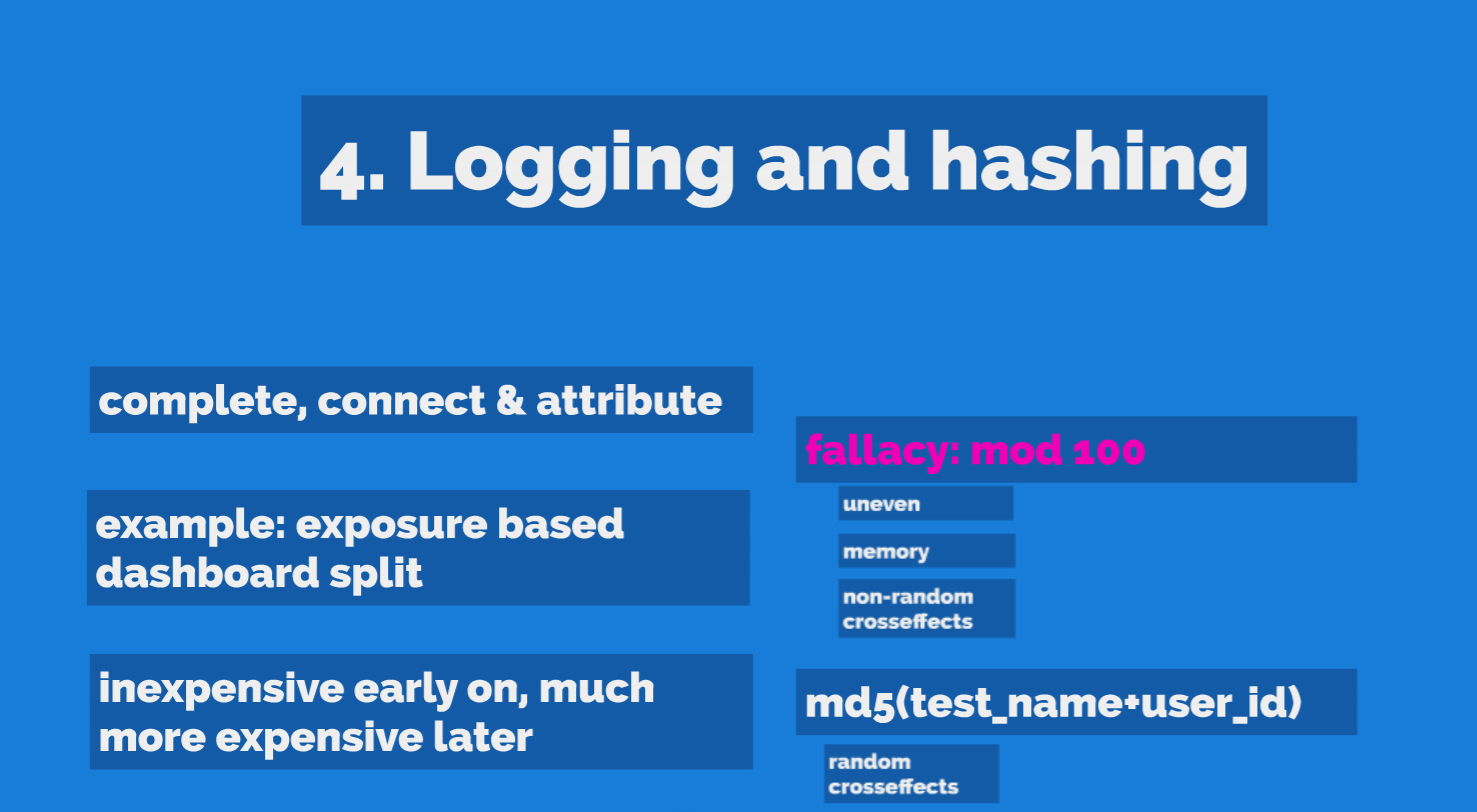
The message around logging is pretty simple. Make sure that your product has the logging in place to tell which user was exposed to which treatment, and that you can connect your target metric. When I say you can connect your target metric, I mean that you can attribute the bottom of the funnel with what's happening in your A/B test. So if your A/B test is about which pricing page variant you show, and your target metric is revenue, you have to be able to connect the users to the purchases (and refunds, and chargebacks, etc). Sounds easy, but there are lots of caveats. For example, you have to make sure they always see the same pricing page. Or maybe there are 10 other ways to make a purchase. And so on. Or maybe your target metric is time spent, in that case you want to be able to slice that. Think it through, and make sure you have enough logging in place that you can compute your results at the end. It sounds easy and obvious, but it's actually pretty hard to do, because in a reasonably complex application, events come from lots of different sources on the site, and you have to make sure the logging is good and uniform everywhere.
Also, make sure you have a dashboard that shows, based on the logs, what % of your users are seeing which variant. I've seen a situation where the A/B test was essentially misconfigured due to a bug, and the actual exposure %s were different than what we thought it is. It would have been easy to catch if you just show this simple split in users, but we didn't. If one of the variants is performing very poorly, this can be very painful.
Logging is an investment you want to make early on in the game. At that point it's pretty cheap, because the code for this is not terribly complex even for a moderately site. But if you don't do it, then it will be very hard and painful later, because you have to go through your entire product and change the logging. That is so painful that it pretty much requires executive buy-in, because product teams need to stop what they're doing and fix the logging.
A related issue is hashing. Suppose you have an A/B test that you want to run on 10% of your users. So you want to run A for 5% and B for 5%. So who should those 10% be? A deceptively simple answer is, let's take the user's user_id, and take the modulo 100. Modulo 100 is just the fancy term for taking the last 2 digits of the number, like 11 or 39. There happens to be 100 two digit numbers (00 to 99), you then you can easily think in terms of %s. So you give treatment A to 00-04 and B to 05-09. We ended up assigning these ranges to product teams to use. Team one uses 00-09, team two uses 10-19, and so on.
So what's the problem with this? It turns out there are a number of problems here. Let me point out a couple:
- Uneven distribution: because servers assign user_ids in some systematic way, for example german users are more likely to end up with user_ids that end in 50-99.
- Memory: Suppose you run an A/B test the way I described above, in the first 10%, with an even split. Then it's over, and a week later, you run another one, with the same split. You risk contaminating the new test with the effects of the old tests, because users remember! Eg. if they got frustrated with the previous B, then you'll measure that frustration for your new B, too.
- What if you have more tests to run then you have ranges, or a product team wants to run more tests in its own range. It just becomes hard to do the accounting, and it becomes error-prone. The problem is, if you start to overlap A/B tests, and different A/B tests overlap in uneven ways, then you risk measuring the effects of other A/B tests, and not your own.
Hashing: Fortunately there's an easy way out of this, and that's to use hashing, and I hope everybody is already doing that and nobody is learning anything here. Hashing just means that for each test, you randomize your users, and divide them into buckets after randomization. It's simple, you can take the name of the A/B test and combine it with a user_id or session_id, and use a standard hashing function like MD5(). This will generate a number that's unique for each test+user combination. Then you can actually use the modulo rule above, and take 10%, and so on. Because the randomization is different for each test, the tests will overlap (whether they're running at the same time or one after the other) in random ways, so other tests will "contaminate" your A and B to the same degree, so you can still measure the lift. This also shows that when you're doing a large number of A/B tests, you're never really measuring the “true” value of metrics, your measurement are always affected by other tests; but if you’re using md5(test_name+user_id) hashing both your variants are equally affected, by a constant background lift, so your measured lift is still the true difference between your A and B.
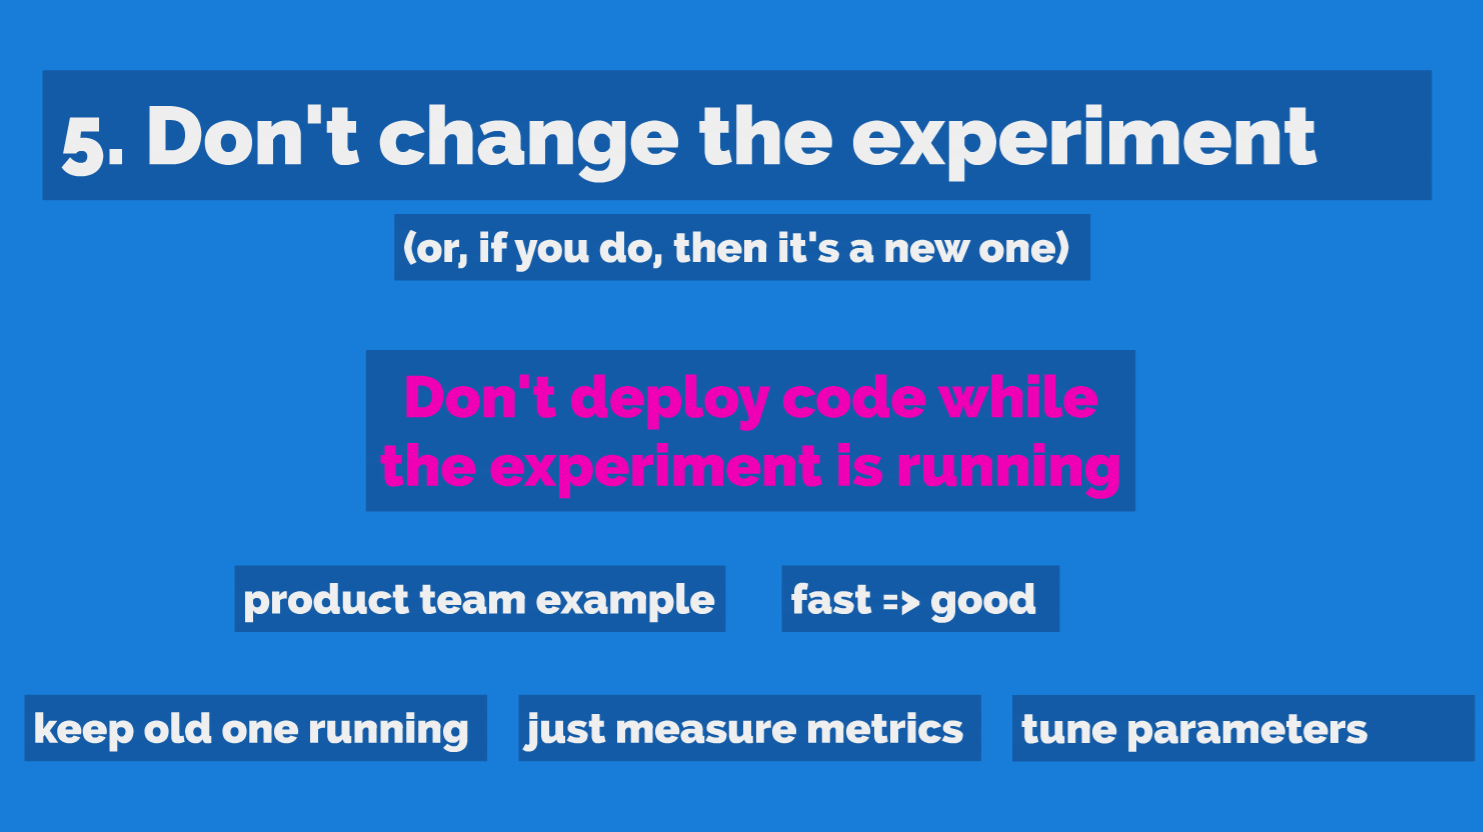
Now we move on to things that are relevant while the experiment is running. The first one says, "Don't change the experiment while it's running".
Let’s take this example: a product team is churning out new versions of a feature every week, and they're A/B testing it. They are using frequentist A/B testing, and they want to prove that B is better than A, so they're trying to:
- build a better product (variant B)
- collect enough samples so that the p-value goes below 5%
The fallacy is, when they release a new version, they don't restart the A/B test, because then they'd have to restart counting the exposures and everything from 0. They just release into a running A/B test, to “keep the existing samples”. But you shouldn't do that, because you're cheating. Of course it's fine to release minor bugfixes and such, but if you want to run an A/B test where you take the p-value seriously at the end, then the "treatment" that you expose your users to has to be constant and fixed. Otherwise it's possible that the initial version was good, and that got some good conversions, and then subsequents were not good, but then statistical significance was reached, so now you think your final version is good. Imagine doing coin flips, and you’re trying to tell whether the coins are different, but you keep changing one of the coins, but not resetting the counts. What does the final result say about the final coin? Not much.
Of course, if you're very quickly releasing new versions, that's a good thing. There are three things you can do:
- Keep the old ones running "in the background" for long enough to get enough samples.
- Restart the experiment each time, and since you have lower counts, accept lower p-value thresholds, and hence accept more false positives. Remember, there's nothing magic or special about 5%.
- Do release the new version into the running test, but in that case you shouldn't calculate the p-value, just look at the time series for A and B, and if you have enough users, maybe you can see the difference between A and B, and between the versions of B. Or maybe you won't be able to.
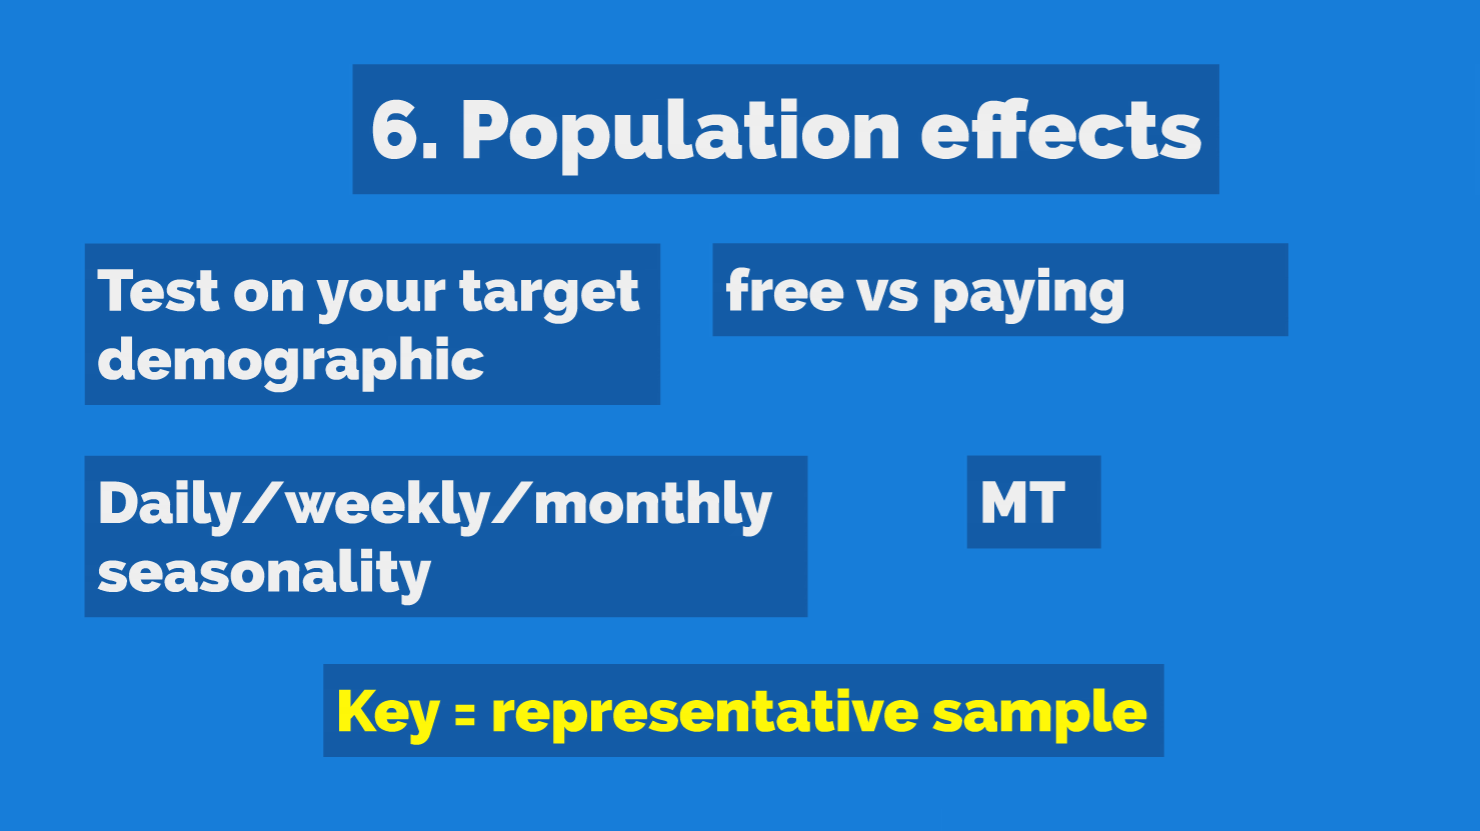
This one is also pretty simple, but it's hard to be disciplined about. So suppose you have a freemium product and you want to make more money. But only a fraction of your users is a paying user, so you test on free users, because you have plenty of that. That's great, but:
- You won't be able to measure revenue related metrics.
- Users who don't want to pay for your product will be fundamentally different from users who do, so you're not really measuring on your target demographic.
The other fallacy here is to run a test for 12 hours on Wednesday. The problem is that if your German users are up, your Chinese users are asleep, and so on. So depending on your user base, it's possible that the sample was not representative. Weekly seasonality is a similar story, don’t run a test from Friday to Tuesday. I found in most cases it's a good idea to run tests for multiples of 7 days. Even tougher is the yearly seasonality. For example, during the summer students and teachers are on vacation, so if your product has a mix of students and teachers, that mix will change sharply between June and September. Fortunately these are all things you can be cautious about and take into account, even correct.
The keyword is representative sample, you have to run your test on a representative sample.
Mechanical Turk. Sometimes at A/B testing talks the question comes up, what if you have a small site, not a lot of visitors, and you want to do A/B testing, and the speaker will say you can use Amazon Mechanical Turk. I think this is dangerous. For many SaaS sites your measurements will be meaningless, because people getting paid to take your test will behave differently from your real users. So what can you do?
- From a math perspective, if you don’t have enough users, you’ll have to accept higher false positive/negative rates.
- Perhaps you should (take exception to one of the fallacies I have here, and) concentrate on an intermediate metric, like how much time visitors spend on your site, did that increase significantly? Or look at heatmaps.
- If you don’t have enough traffic, you could concentrate on getting more traffic, by eg. purchasing email lists.
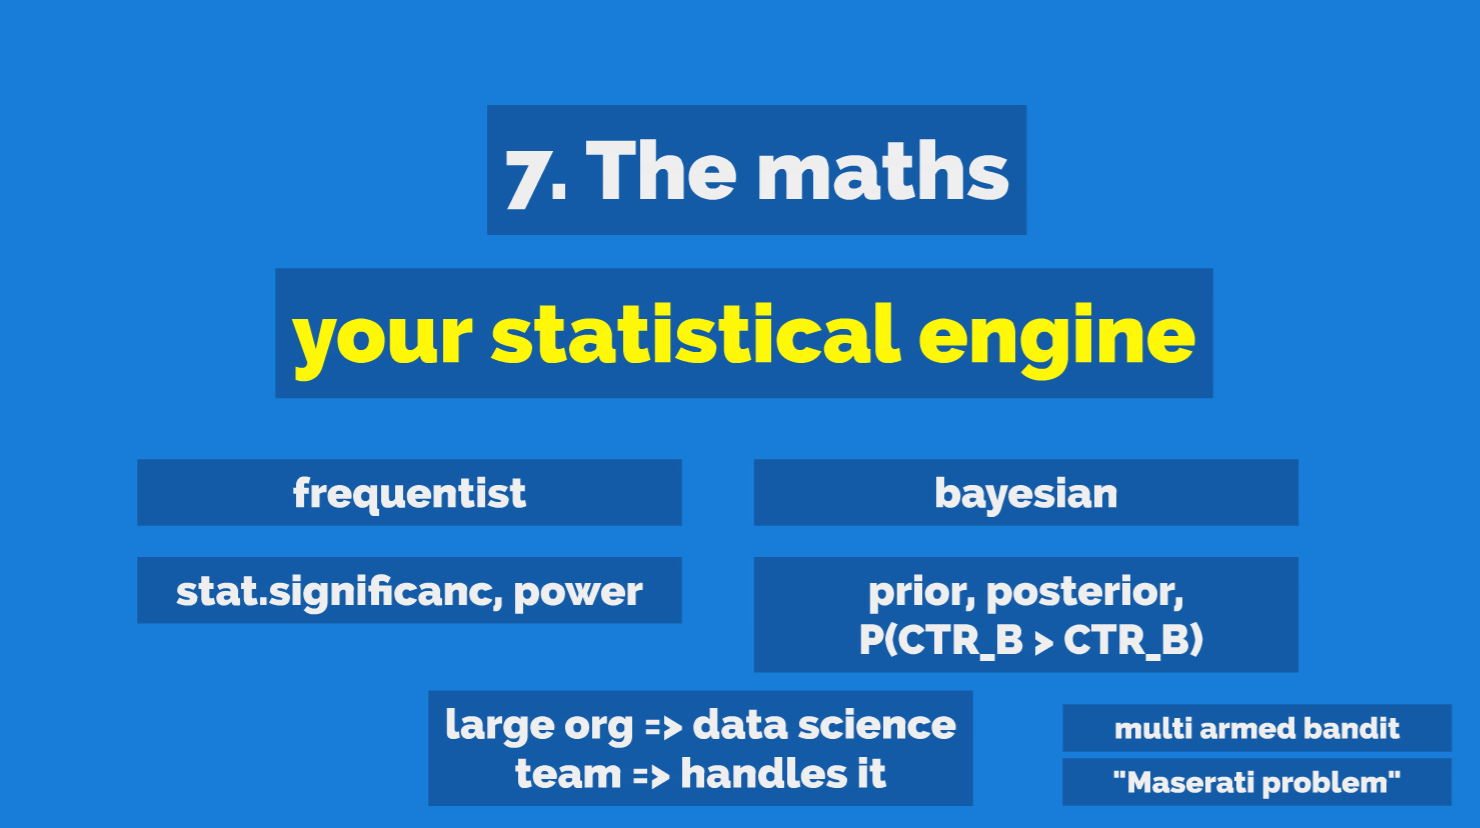
This presentation is not specifically about the mathematics of A/B testing, so I decided not to talk too much about it. What is perhaps interesting is that there's 2 distinct schools of thought about A/B testing: frequentist and bayesian.
The frequentist view of the world is an objective view. They say that there is a true conversion rate of A and B, and you could in theory repeat your finite A/B test an infinite number of times, each time collect only a finite number N of samples, and they say you should worry about your false positive and false negative rate. The concept of statistical significance is about false positive rates, the concept of statistical power is related to false negative rates. False positive is when B isn't better than A, but you measure B to be better and keep it. False negative is when B is better than A, but you measure it to be worse or your experiment does not reach significance, so you reject it. So in the frequentist view, you, the observer is not a part of the picture, you're just controlling statistical fluctuations.
The bayesian approach is one where the observer is part of the picture. Essentially, it starts by asking what your belief is about A and B's conversion rate, this is called the prior, and then updates this belief after each and every observation. The end-result is something called the posterior, which is the current best-guess about A and B, based on what we've seen.
Personally, I like the bayesian approach better. The reason is that the frequentist approach is very hard to use and the quantities it deals with are not intuitive. The way to conduct a frequentist approach requires the product manager, or somebody:
- to guess how big the lift will be; this is necessary to figure out how many samples N to collect
- understand the concepts of statistical significance (~false positive rate) and statistical power (~false negative rate); based on my experience, many non-technical people like product managers are confused and easily misled by these
- not commit a number of mistakes, such as peeking and stopping early
The bayesian approach, on the other hand, is more natural. It does not solve all these issues, but at least it operates with more easy to understand terms like "What is the probability that B is better than A? The probability---based on the observations so far---is 82%". Note that this is not the same thing as (one minus) statistical significance.
Personally, I would use a mix of bayesian and frequentist today; frequentist to gauge how long to run a test, bayesian to evaluate (but also show frequentist results in small print). Note that large organizations which can afford to hire a team of smart data scientists can essentially go either way, because that team will make sure the decisions are statistically sound.
There are other approaches like Multi Armed Bandit, which is about regret minimalization. This says, if one of the variants is performing better, let's show that more often, so as not lose conversions. So it dynamically re-allocated traffic between A and B based on current conversion rates.
Maserati problem. A Maserati problem is a "nice to have problem", like "once I'm rich, should I buy a Maserati or a Ferrari". In my experience, chosing between these statistical engines is a nice problem to have, if this is your biggest concern, it means all your logging is good, you have good metric, you have enough traffic, you're not committing any of these fallacies. The flipside is, if you have problems with more basic things like logging, you probably shouldn't obsess too much about the math: as long as you're feeding wrong numbers to the equations, your number one priority should be to fix that, as your numerical results will be wrong or off.
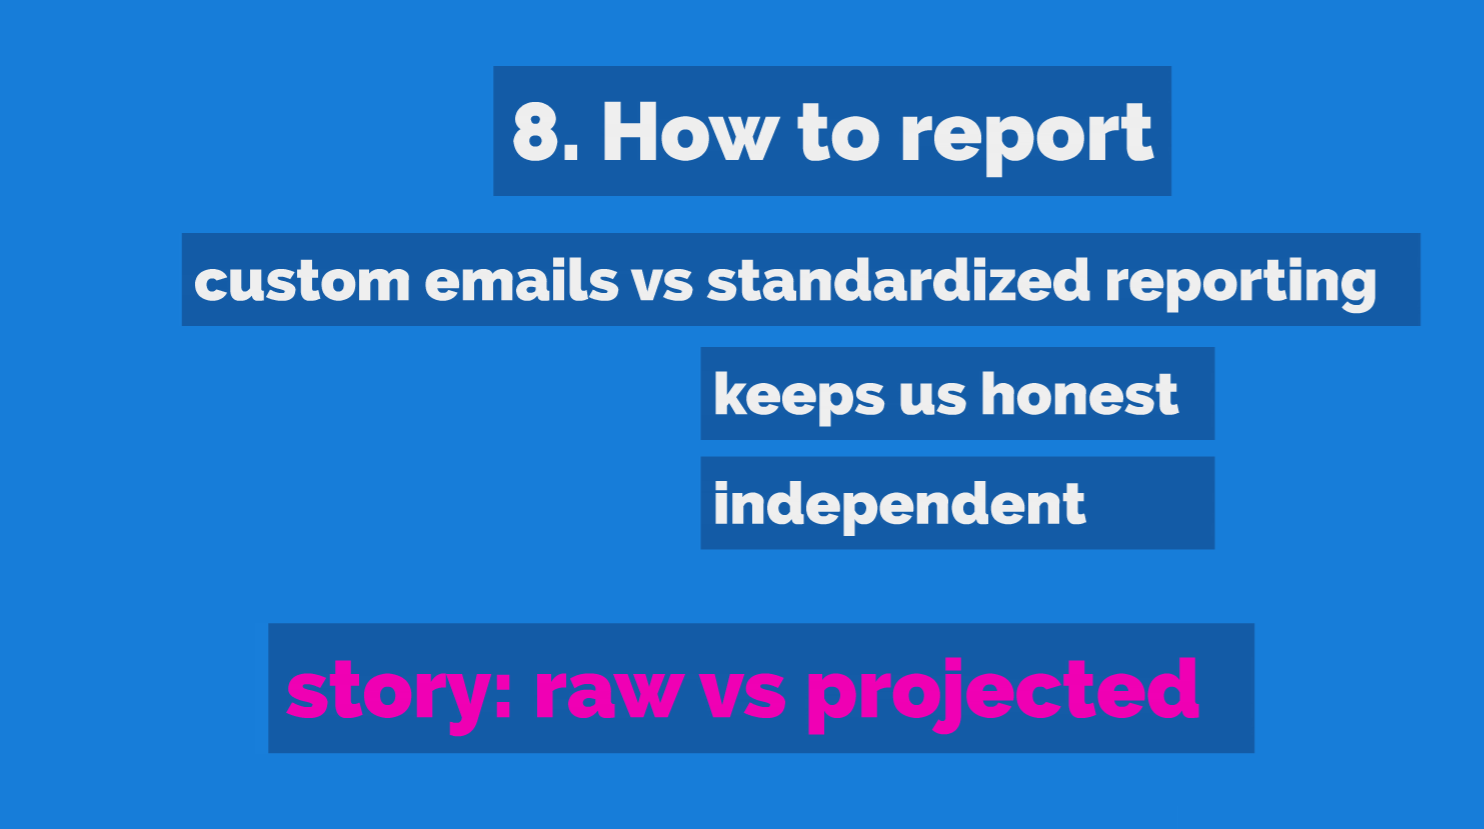
Now we move on to what to do after the test is finished running. The first question is, how to report the results, whatever they are. I found it's very important to have a standardized reporting tool for A/B results, and not have PMs write their results in custom emails that get sent around. There are two reasons. One is, it helps to keep us honest. If there is standard tool where everybody can go and check out results, there’s less of a chance that people will cherry-pick, and just talk about the good results, or do metrics data mining, the fallacy I mentioned before. Also, it conditions stakeholders and executives to a standard format, so they’ll get used to a standard set of numbers, how they’re presented. They’ll get used to usual lift %s, so they can relate results to past results, have expectations.
One story I want to share is related to raw vs projected results. So in this case there was no standardized reporting, and the results were communicated in email, and the result was like a 40% lift. So everybody was happy, and they were right to be happy, and the thing got deployed to 100% of users. Then a month later the team got an email from the CEO, asking why the metric is flat, if the thing got us a 40% lift. So it turns out that the PM was talking about raw lift %, which is the lift you see among users who actually use that feature in the product. Think of the feature like a dialog in a big application. But let’s say only 1% of users ever use that. Then your overall or projected or top-line lift will only be 0.4%. So that’s why the CEO didn’t see a big lift across the company, because the result was miscommunicated and a false expectation was set.
So the lesson, keep your raw and projected (to all users) lift separate, and report in a standard way to your stakeholders!
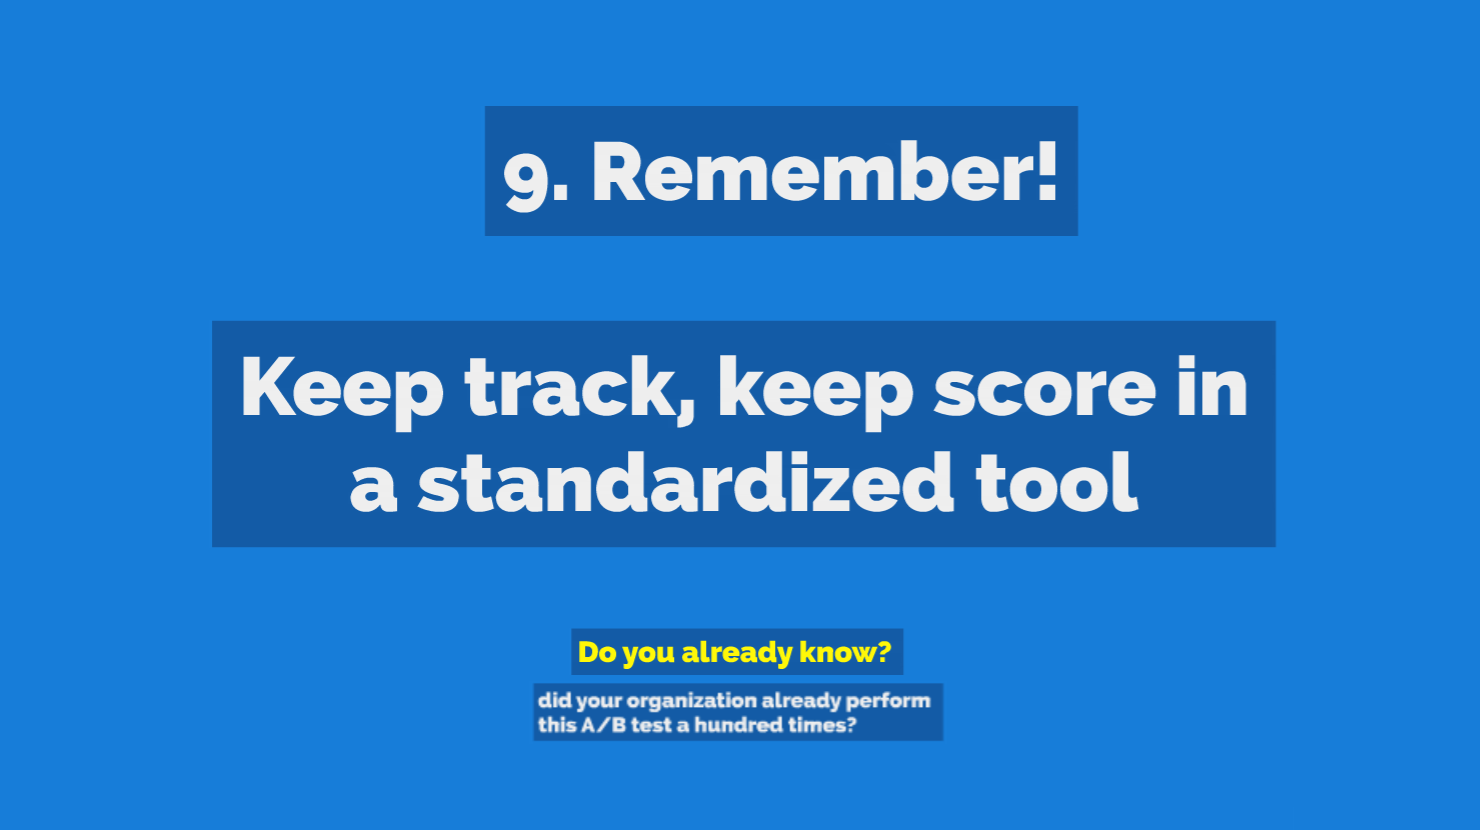
This point just says remember, and it connects back nicely to the first point, where I said you should ask yourself, do you already know? The example I gave there was about the green button, which has been tested and always performed better in emails than the blue ones. So the way to make sure your organization learns and doesn’t repeat experiments if you record them in a tool. That way you look them up and reference them later. Referencing them is important, because people’s memory gets worse over time, so it’s important to have raw results that you can point to to make arguments. This also ties in with the previous point about standardized reports, once you have standardized the reporting then it’s probably easy to keep them around. If you don’t have a fancy tool, you can just use a standard Google Docs template and put it into a shared folder!
There are a number of other topics around A/B testing that would be interesting to talk about, these were the ones that were the most important lessons for me over the last few years.
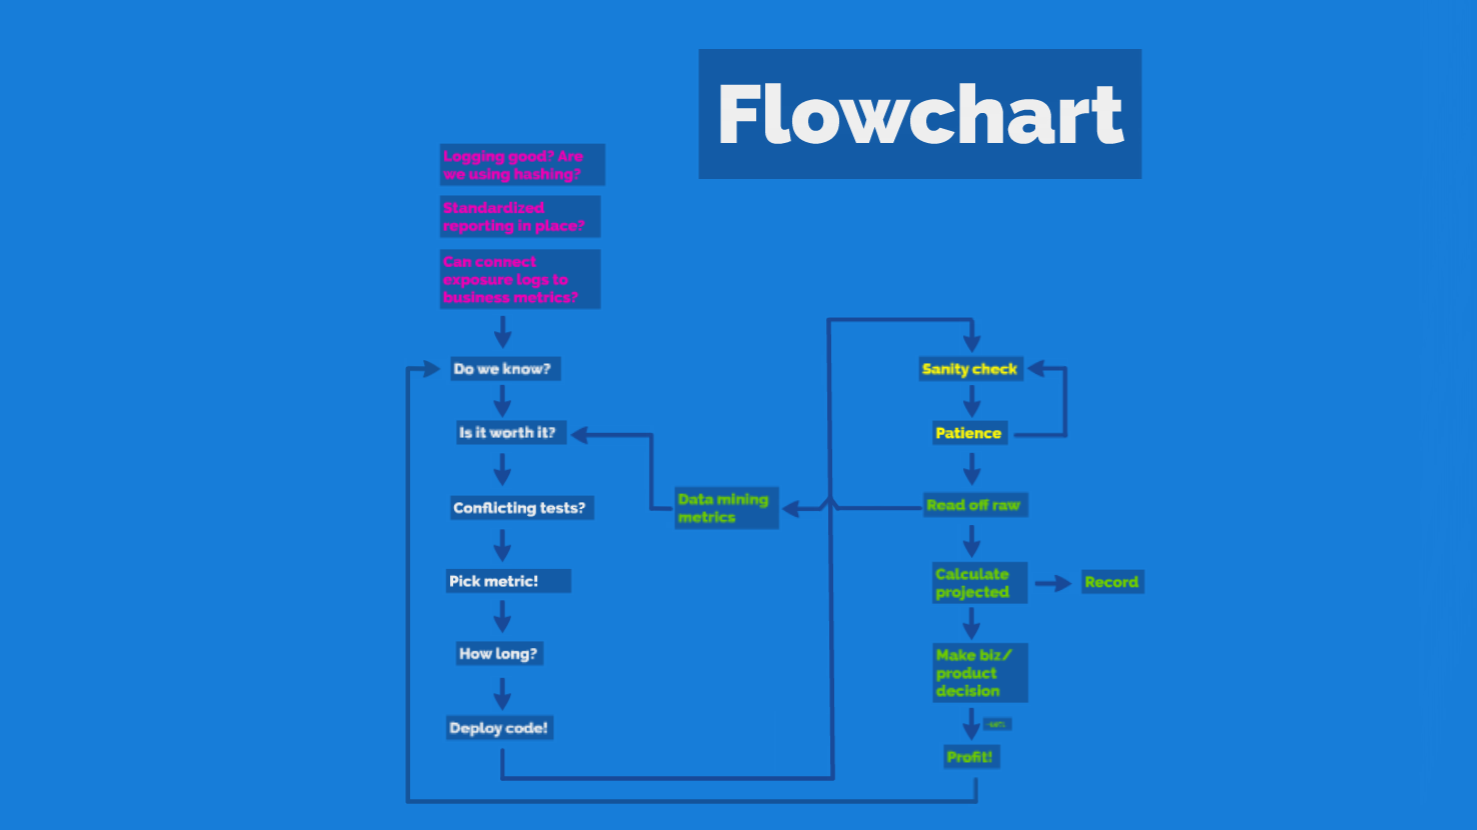
Based on these lessons I constructed this simple flowchart, what a good A/B testing procedure looks like. There’s the Build-Measure-Learn cycle from Lean Startups, this is sort of an exploded view of that. Speed is very important, at large sophisticated websites only 1 in 10 experiments yields a clear lift, so you have to be fast to get to the wins.
References
- Prezi of this talk
- Think Bayes: free book
- Think Stats: free book
- How to Measure Anything - good book, though not specifically about A/B testing
- Evan Miller’s site: articles and tools about A/B testing
- Variance Explained: articles about A/B testing
- Ron Kohavi’s articles: he worked A/B testing at Bing
- Group Sequential Testing: how to take into account peeking in frequentist experiment design
- Youtube: talk from the CEO of Optimizely on A/B testing lessons learned after 100,000+ experiments
- Youtube: A/B testing war stories from Etsy
- Youtube: A/B testing math from a Groupon statistician
- Youtube: introductory talk on Bayesian A/B testing
- Wikipedia: starting point on A/B testing