Random numbers, the natural logarithm and higher dimensional simplexes
Marton Trencseni - Sat 17 April 2021 • Tagged with bayesian, ab-test
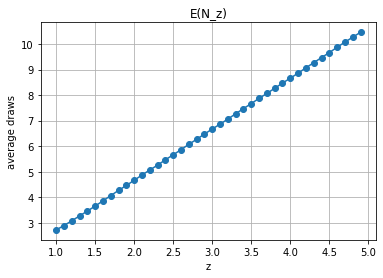
The base $e$ of the natural logarithm shows up in an unexpected place. Let's derive why!
Marton Trencseni - Sat 17 April 2021 • Tagged with bayesian, ab-test
The base $e$ of the natural logarithm shows up in an unexpected place. Let's derive why!

Marton Trencseni - Thu 18 March 2021 • Tagged with pytorch, autoencoder, mnist
I build an Autoencoder network to categorize MNIST digits in Pytorch.

Marton Trencseni - Wed 03 March 2021 • Tagged with python, pytorch, torchvision, mnist, gan
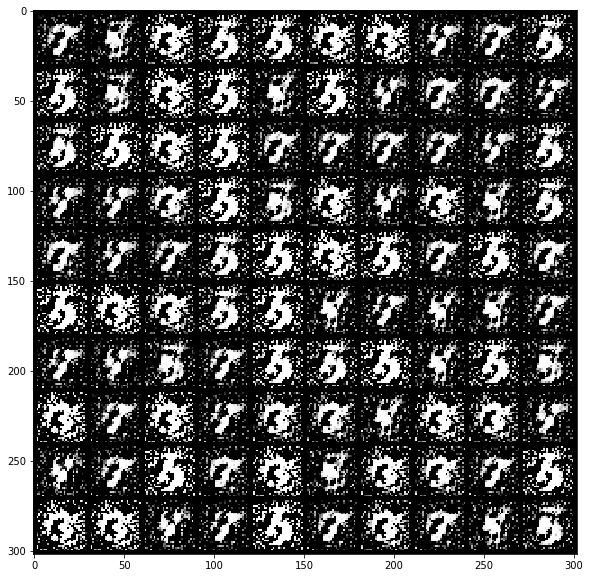
I train a Pytorch Wasserstein MNIST GAN on Google Colab to beautiful MNIST digits.
Marton Trencseni - Sat 20 February 2021 • Tagged with python, pytorch, gan, mnist, google-colab
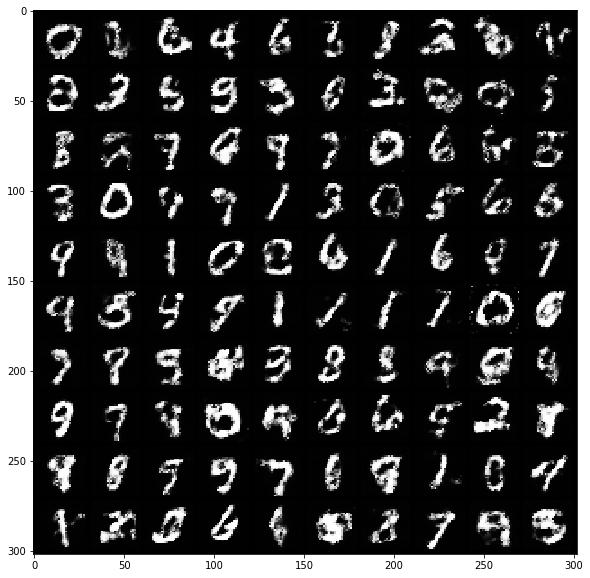
I explore MNIST digits generated by a Generative Adversarial Network trained on Google Colab using Pytorch Lightning.
Marton Trencseni - Sun 24 January 2021 • Tagged with mlflow, tracking
I explore the automatic logging capabilities of MLFlow for Pytorch.

Marton Trencseni - Fri 15 January 2021 • Tagged with mlflow, tracking
I explore the automatic logging capabilities of MLFlow for Scikit Learn. In the process I found a bug in MLFlow, reported it and wrote a pull request to fix it.
Marton Trencseni - Sun 10 January 2021 • Tagged with mlflow, tracking
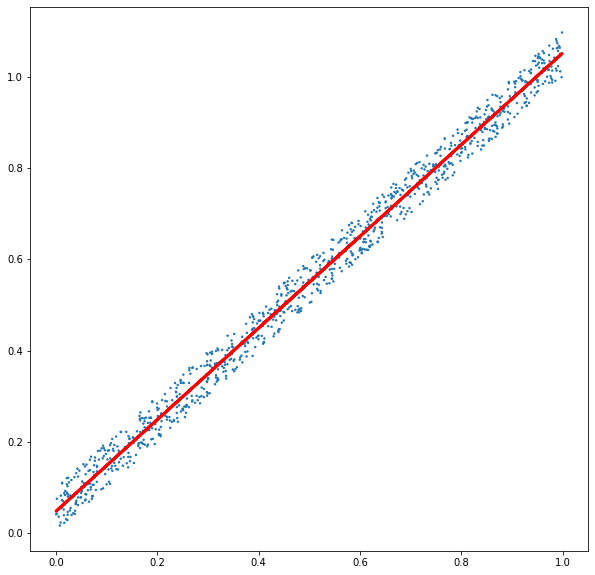
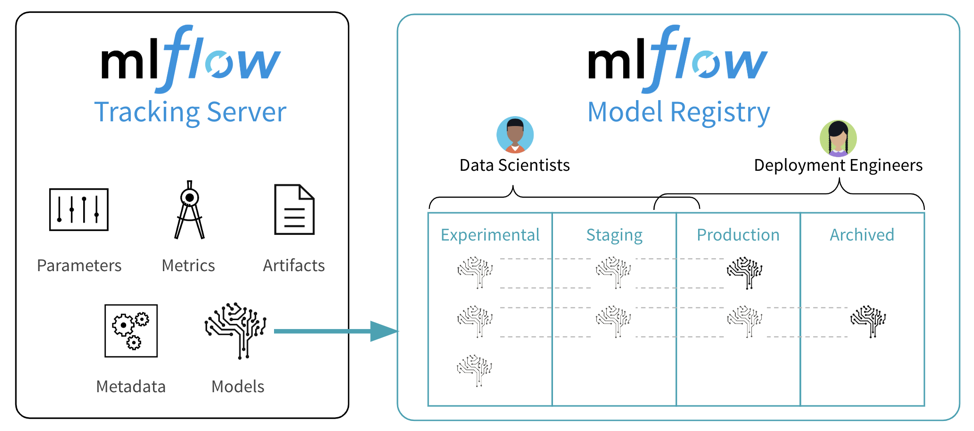
For the last few months I’ve been using MFlow in production, specifically its Tracking component. MLFlow is an open source project for lifecycle tracking and serving of ML models, coming out of Databricks. MLFlow is model agnostic, so you can use with SKLearn, XGBoost, Pytorch, Tensorflow, FBProphet, anything.
Marton Trencseni - Thu 17 December 2020 • Tagged with ab-testing, trump, politics
After the 2020 US presidential election, the Trump campaign filed over 50 lawsuits and attacked the integrity of the elections by claiming there was voter fraud. One of the last lawsuits was filed in the Supreme Court of the United States by the state of Texas. Here I look at the statistical claims made in this lawsuit that were supposed to show irregularities in the Georgia vote.

Marton Trencseni - Thu 03 December 2020 • Tagged with ab-testing
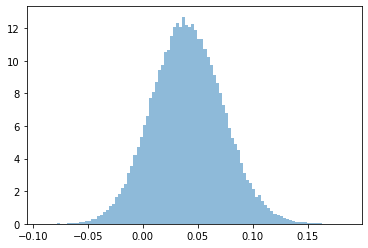
In real-life, non-digital situations, it's often not feasible to run true A/B tests. In such cases, we can compare before and after rollout conversions at a treatment site, while using a similar control site to measure and correct for seasonality. The post discusses how to compute increasingly correct p-values and bayesian probabilities in such scenarios.
Marton Trencseni - Fri 30 October 2020 • Tagged with stats, data
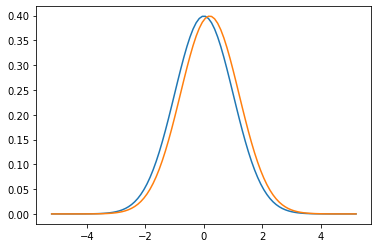
Sometimes we look at the top performers in a field and see obviously uneven representations of groups (gender, ethnicity, etc). There a multitude of factors that can lead to it, such as unfair bias in access to opportunities. Here I will show one unintuitive mathematical effect that can contribute to such unevenness in the case of normal distributions.
Marton Trencseni - Tue 01 September 2020 • Tagged with charts, dashboards, data, visualization
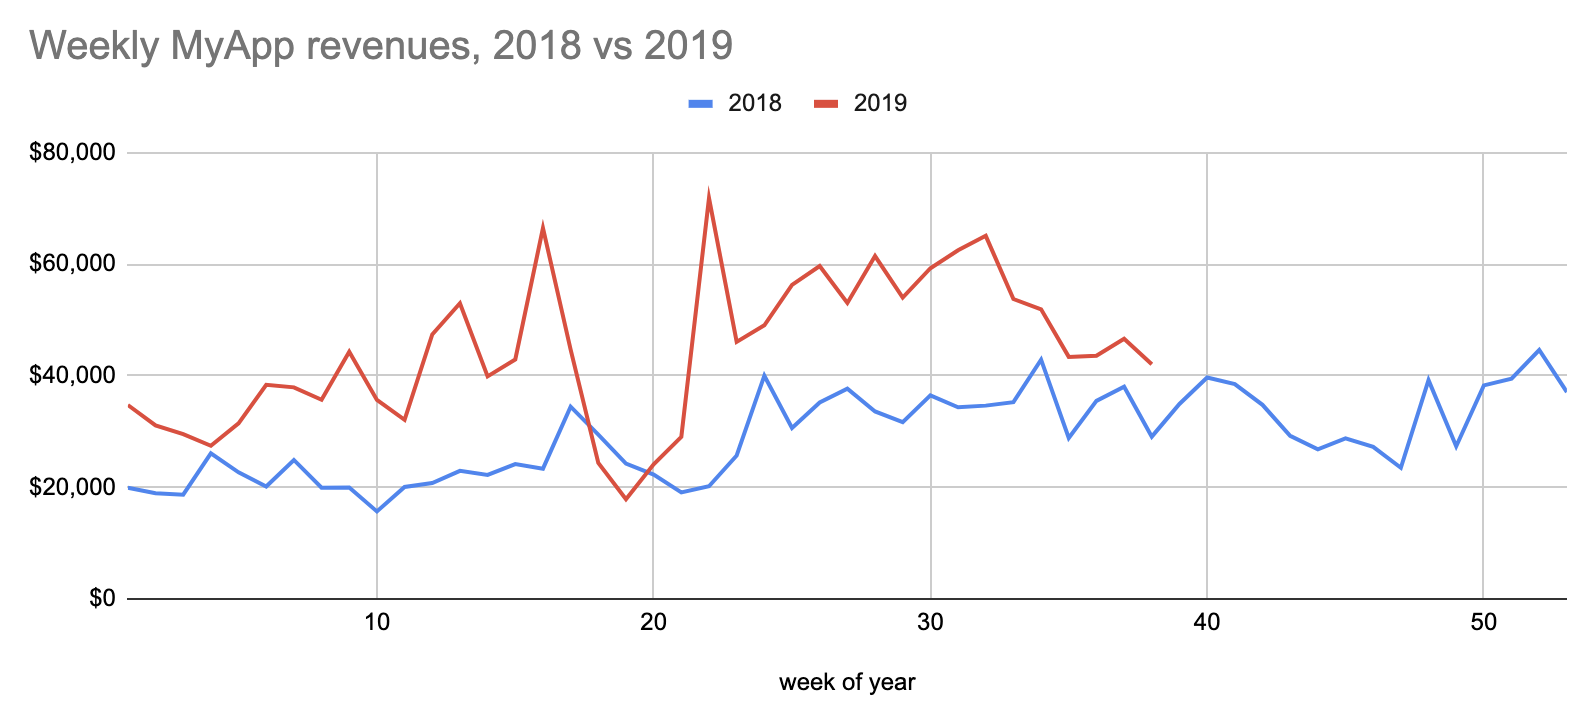
Most charts should be line charts or stacked area chart, because they communicate valuable trend information and are easy to parse for the human eyes and brain.
Marton Trencseni - Sun 23 August 2020 • Tagged with charts, dashboards, data, visualization
Format numbers for human consumption. What is more readable, 1.539e+5 or 153,859? Showing numbers effectively on spreadsheets, charts, dashboards, reports is a basic ingredient for readability, like formatting code in programming.

Marton Trencseni - Sat 22 August 2020 • Tagged with charts, dashboards, data, visualization
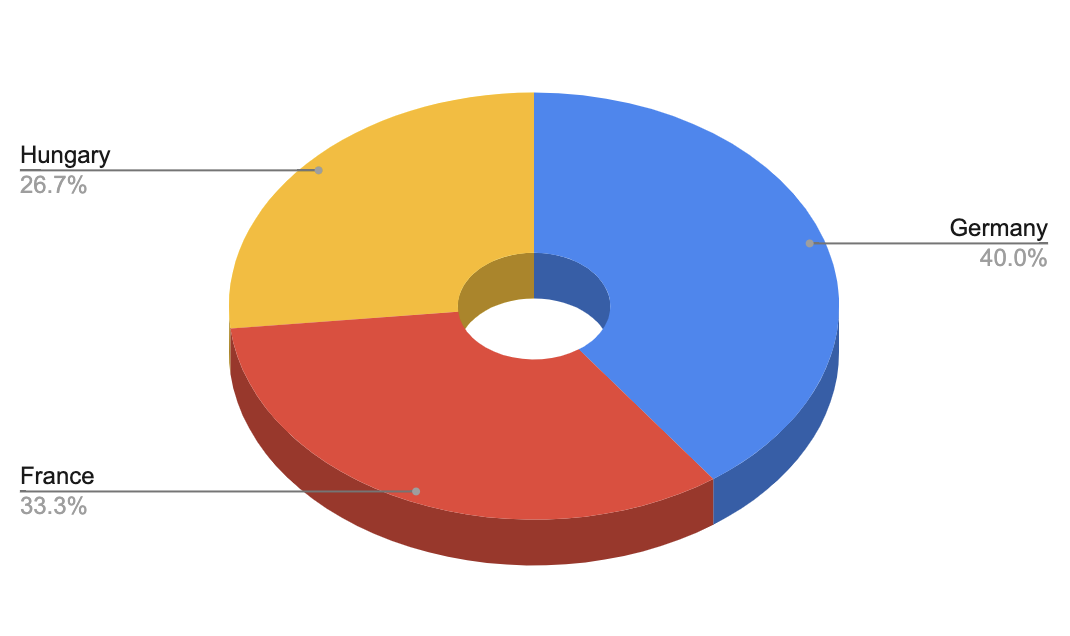
Making clear, readable charts is part of the craftmanship minimum for any data related role. In part one, I look at how to present categorical data.
Marton Trencseni - Fri 21 August 2020 • Tagged with ab-testing
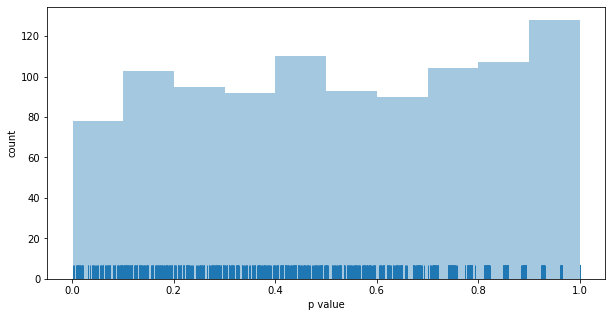
I use Monte Carlo simulations to explore the false positive rate of Multi-armed bandits.
Marton Trencseni - Fri 07 August 2020 • Tagged with ab-testing
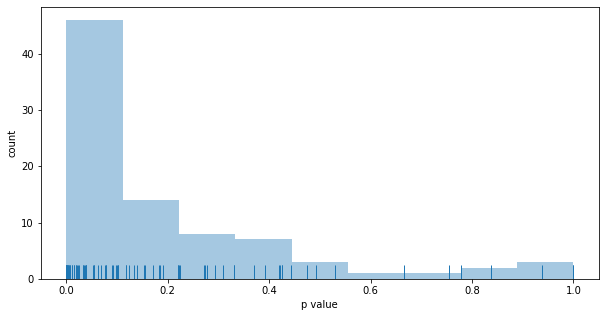
Multi-armed bandits minimize regret when performing A/B tests, trading off between exploration and exploitation. Monte Carlo simulations shows that less exploration yields less statistical significance.
Marton Trencseni - Fri 22 May 2020 • Tagged with ab-testing
PlanOut is a framework for online field experiments. It was created by Facebook in 2014 to make it easy to run and iterate on sophisticated experiments in a statistically sound manner.

Marton Trencseni - Thu 16 April 2020 • Tagged with ab-testing
A/B tests go wrong all the time, even in sophisticated product teams. As this article shows, for a range of problems we can run automated validation checks to catch problems early, before they have too bad of an effect on customers or the business. These validation checks compare various statistical properties of the funnels A and B to catch likely problems. Large technology companies are running such validation checks automatically and continuously for their online experiments.
Marton Trencseni - Mon 06 April 2020 • Tagged with ab-testing
I show using Monte Carlo simulations that randomizing user assignments into A/B test experiments makes it possible to run multiple A/B tests at once and measure accurate lifts on the same metric, assuming the experiments are independent.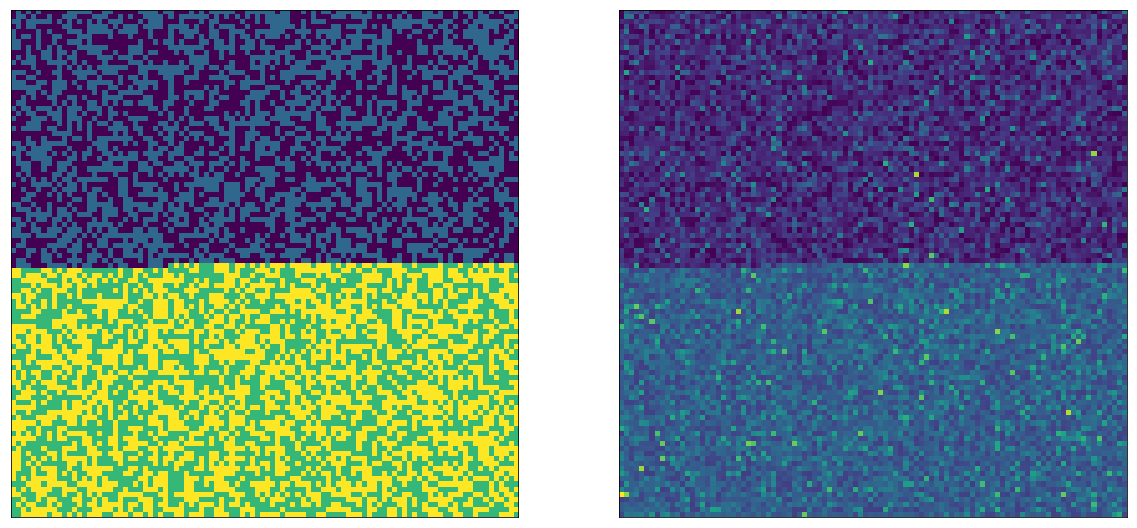
Marton Trencseni - Tue 31 March 2020 • Tagged with bayesian, ab-testing
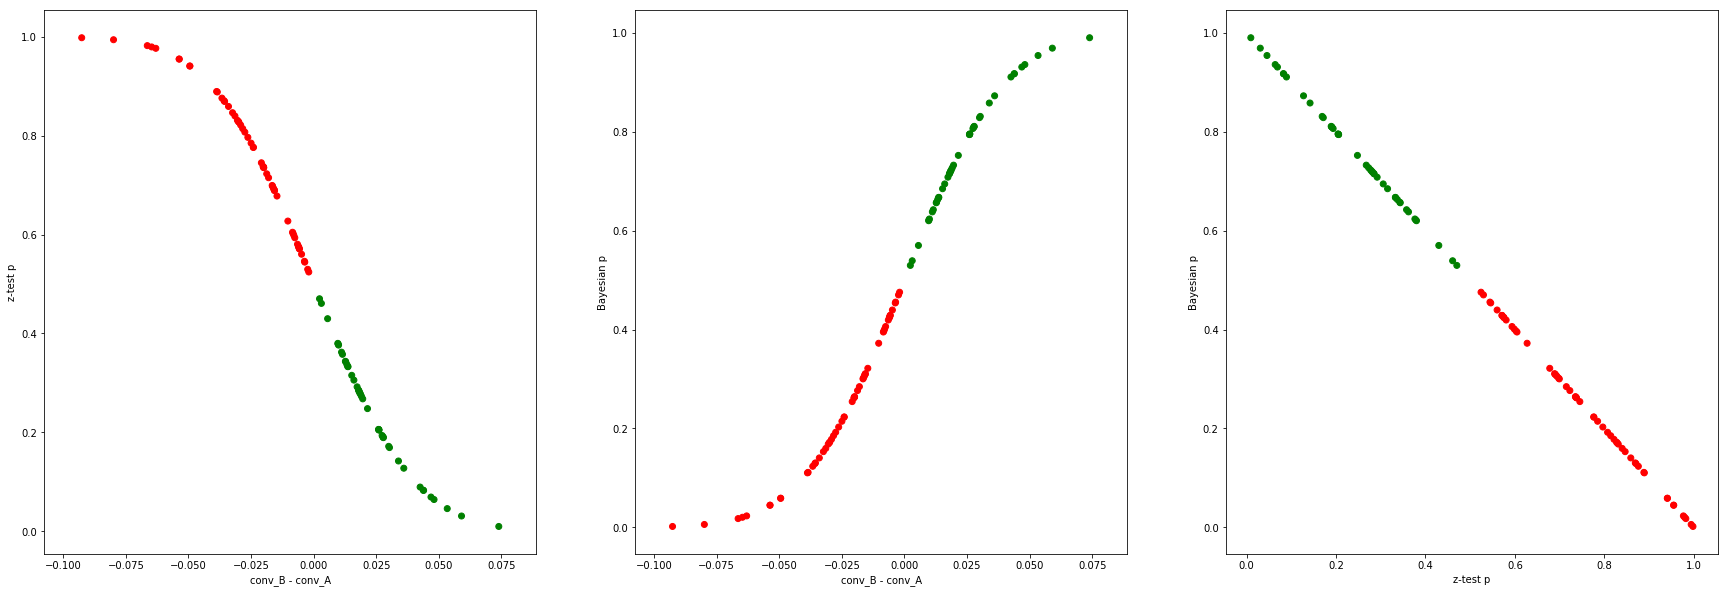
I compare probabilities from Bayesian A/B testing with Beta distributions to frequentist A/B tests using Monte Carlo simulations. Under a lot of circumstances, the bayesian probability of the action hypothesis being true and the frequentist p value are complementary.
Marton Trencseni - Mon 23 March 2020 • Tagged with ab-testing
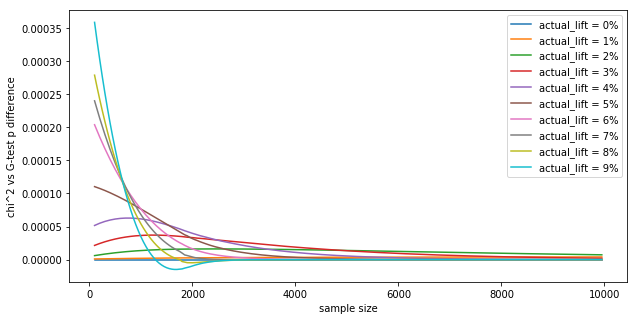
The G-test for conversion A/B tests is similar to the Chi-squared test. Monte-Carlo simulations show that the two are indistinguishable in practice.
